The average 30-year mortgage rate hit 7.03% on Thursday, the first reading above 7% since January 2025 and the highest of President Trump's second term. The same morning, the Census Bureau reported that the median new home now sells for $24,200 less than it did a year ago. Run the payment math on both government releases and the price cut is gone: a buyer putting 20% down on today's cheaper median home pays more each month than last year's buyer paid for the pricier one.
7.03% Is the Highest Rate Since Before Trump Took Office Again
Freddie Mac's weekly Primary Mortgage Market Survey put the 30-year fixed at 7.03% as of September 24, up from 6.95% a week earlier and 6.30% a year ago. The 15-year fixed rose to 6.42% from 6.26%.
We pulled Freddie Mac's full PMMS history file to check the milestone. The last reading at or above this level was 7.04% on January 16, 2025, four days before the inauguration. No weekly average since January 20, 2025 has been higher than this one. For comparison, the peak of Trump's first term was 4.94% in November 2018.
The climb this year has been steep. The 30-year bottomed at 5.98% on February 26, 2026. It has added 1.05 percentage points in the seven months since, including 27 basis points in just the last two weeks.
The 15-Year Rate Jumped Twice as Fast
Most coverage stopped at the 30-year number. The bigger move this week was in the 15-year loan, the product many refinancers and older buyers choose to pay a house off before retirement. It rose 16 basis points in one week, double the 30-year's 8-point gain.
At 6.42%, the 15-year average is now the highest since May 2, 2024, when it stood at 6.47%, according to the same Freddie Mac file. Over the past year it is up 0.93 points, against 0.73 points for the 30-year. The shorter loan has been losing its discount faster than the headline rate suggests.
Builders Cut the Price. The Rate Took It Back.
The Census Bureau and HUD's August new home sales report, released at 10 a.m. Thursday, put the median sales price of a new home at $393,700. In August 2025 it was $417,900. That is a 5.8% drop, and builders have been leaning on discounts to move inventory.
Here is what that discount buys after this week's rate move. Freddie Mac's survey assumes a buyer with 20% down and excellent credit, so we used the same assumption on both medians and calculated principal and interest only, before taxes and insurance:
- August 2025: $417,900 home, $334,320 loan at 6.30% for 30 years works out to about $2,069 a month.
- August 2026: $393,700 home, $314,960 loan at 7.03% for 30 years works out to about $2,102 a month.
Today's buyer borrows almost $19,400 less and still pays about $32 more every month. Over the full 30 years, that buyer pays roughly $441,700 in interest, about $31,000 more than last year's buyer on the bigger loan. On a 15-year loan the result is even starker. At 6.42% today versus 5.49% a year ago, the monthly payment on each median home comes out to $2,729.81 and $2,729.90. The $24,200 price cut saved that buyer nine cents a month.
By our math, the discount only kept the 30-year payment flat as long as rates stayed below about 6.88%. The weekly average crossed that line on September 17.
Is the $24,200 Price Cut Even Real?
Part of it may not be. The Census report's own explanatory notes warn that changes in the median price reflect shifts in which houses sold, not just what builders charged for the same house. Its price-range table shows that shift in August. Homes under $300,000 made up 22% of new home sales, up from 18% a year earlier, while homes at $1 million and up fell from 7% of sales to 4%.

The U.S. Census Bureau headquarters in Suitland, Maryland. The bureau and HUD jointly publish the monthly new home sales report. (U.S. Census Bureau, via Wikimedia Commons, public domain)
In other words, buyers are moving down-market to find a payment they can carry. The 5.8% drop in the median also falls inside the report's own margin of error of plus or minus 8.2%, so Census does not call it statistically significant. The 8.8% drop in the average price, which the heavy mix of cheaper homes pulls down harder, is significant.
Official record
U.S. Census Bureau and U.S. Department of Housing and Urban Development, Monthly New Residential Sales, August 2026, Release Number CB26-155, September 24, 2026.
"Changes in sales price data reflect changes in the distribution of houses by region, size, etc., as well as changes in the prices of houses with identical characteristics."
Census Bureau, explanatory notes to the August 2026 release
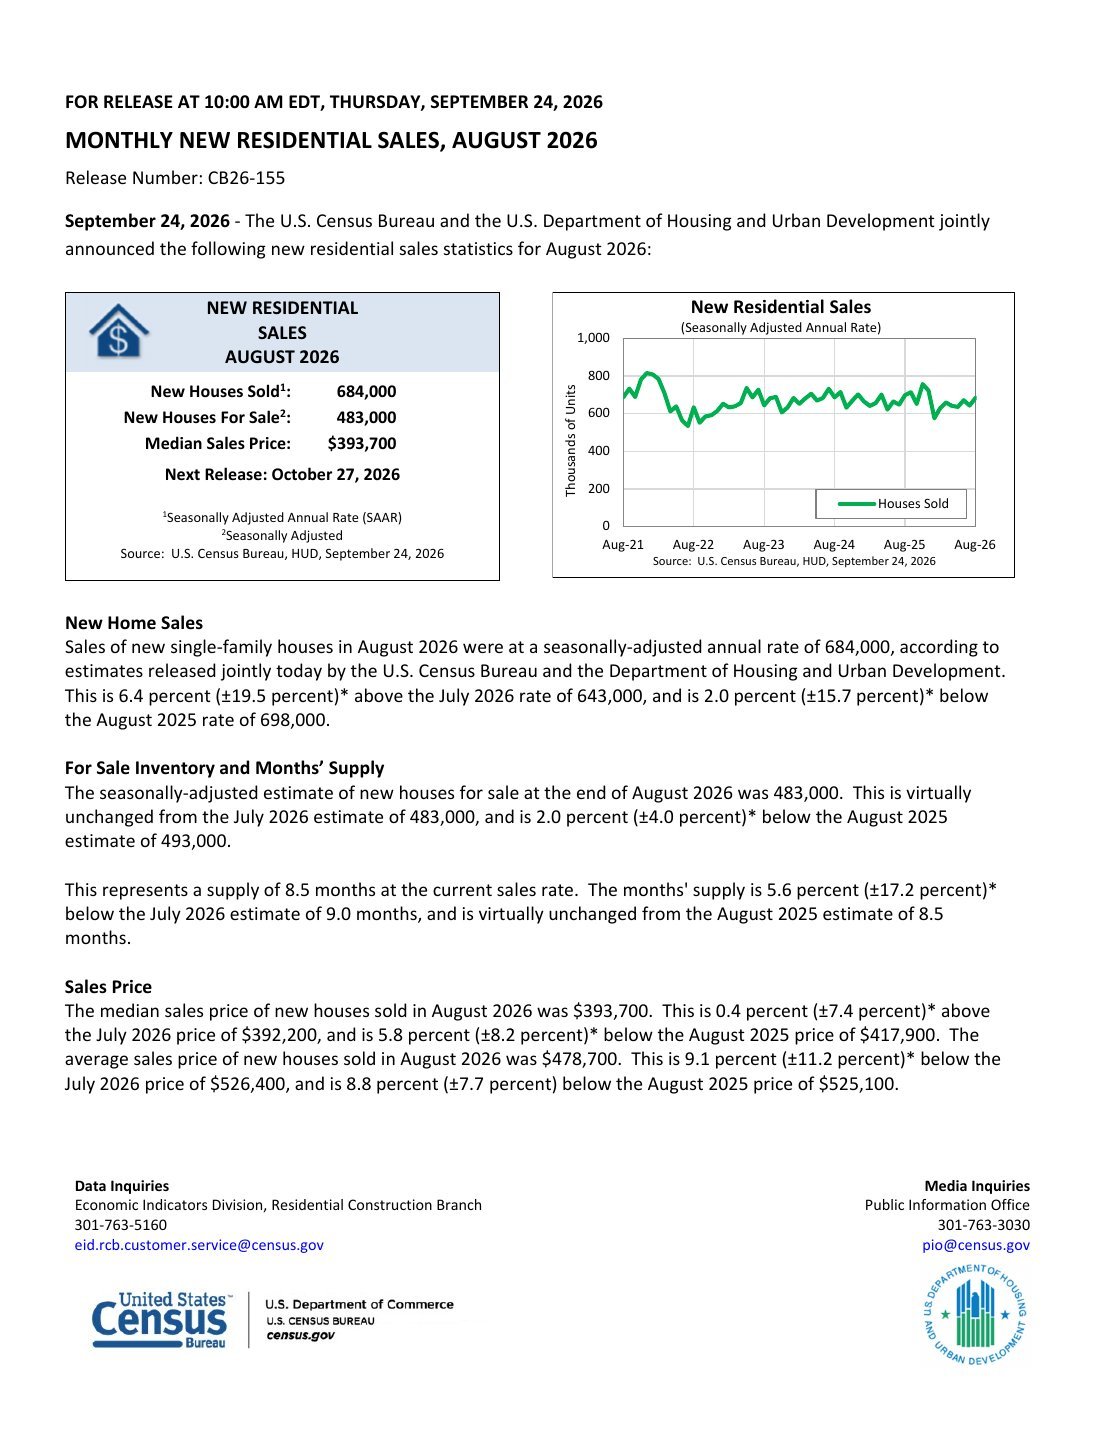
Read or download the full 5-page release (PDF) · original on census.gov
Sales themselves ticked up to a 684,000 annual pace in August from 643,000 in July. That 6.4% gain carries a margin of error of plus or minus 19.5%, and year to date, new home sales are running 2.9% behind 2025. The West was the weak spot, with sales down 26.8% from a year ago.
A Booming Economy Is What Pushed Rates Higher
Mortgage rates track the 10-year Treasury, and the 10-year had a rough week. The Treasury Department's daily par yield curve shows the 10-year at 4.96% on Monday, 5.11% on Wednesday and 5.18% at Thursday's close. It started the year near 4.2% and bottomed at 3.97% in late February.

The U.S. Treasury Building in Washington, with the Washington Monument in the background. (MeanieHyaena, Wikimedia Commons, CC BY 4.0)
Wednesday's jump followed the September flash survey of U.S. purchasing managers, whose composite index came in at 58.4 against a forecast of 55.2, the strongest private-sector reading since July 2021. "Business is clearly booming now in both manufacturing and services," said Chris Williamson, chief business economist at the data firm that runs the survey. He also warned that input costs rose "at the steepest rate for four years," driven by fuel and transport.
The job market is not cooling either. The Labor Department reported 197,000 initial jobless claims for the week ending September 19, the fewest since mid-July, according to the Associated Press. That follows the record-low claims pace we covered last week.
Next Week's Rate Is Already Baked In Higher
There is a timing detail in the 7.03% number that matters for anyone shopping right now. Freddie Mac builds each weekly average from loan applications submitted through Wednesday, then publishes on Thursday at noon. That means Thursday's 10-year close of 5.18%, the highest yet, came after the survey window closed.
Daily rate trackers, which use their own methods, were already higher. U.S. News headlined its September 24 daily report "Today's Mortgage Rates Jump Past 7.3%." Unless bonds reverse sharply before Wednesday, next Thursday's Freddie Mac figure starts from a higher base.
Freddie Mac's chief economist Sam Khater struck an upbeat note anyway. "The housing market remains supported by a solid labor market and an economy that is growing at a healthy rate," he said in Thursday's release. That is true for sellers of cheaper homes. It is cold comfort for the family whose payment went up on a smaller loan.
Why This Lands on Trump's Desk
President Trump has been demanding lower rates for months. Breitbart reported that he posted on Truth Social last week that "interest rates in the United States should be 1%, or less." Instead, the Federal Reserve under his own pick, Kevin Warsh, raised rates on September 16, and markets are now pricing in another hike.
The bond market is sending a mixed message to the White House. The economy Trump promised is showing up in the data, with booming business activity and layoffs near their lowest in decades. But the 10-year yield is at its highest since 2007, and that strength is exactly what is pushing mortgage costs up. Two government reports on Thursday showed that a sale price that looks cheaper on paper can still cost a family more every month.
The next checkpoints come quickly. The Commerce Department releases August PCE inflation, the Fed's preferred gauge, and its final second-quarter GDP estimate on September 30. Freddie Mac's next weekly survey follows on October 1.
Top photo: New home construction at the Blackhawk subdivision in Pflugerville, Texas. (KevinMoralesRealtor, Wikimedia Commons, CC0 public domain dedication)