The September jobs report showed just 29,000 new jobs, and that is the number every network led with Friday. Pull the government's own tables, though, and a bigger story shows up: federal payrolls fell to 2,682,000, the fewest since May 1966, while private employers have now added 1,006,000 jobs since President Trump took office. We checked the White House's claims about the report against the raw BLS data. Two hold up. A third needs an asterisk.
The 29,000 Headline Is Real. So Is What Sits Under It.
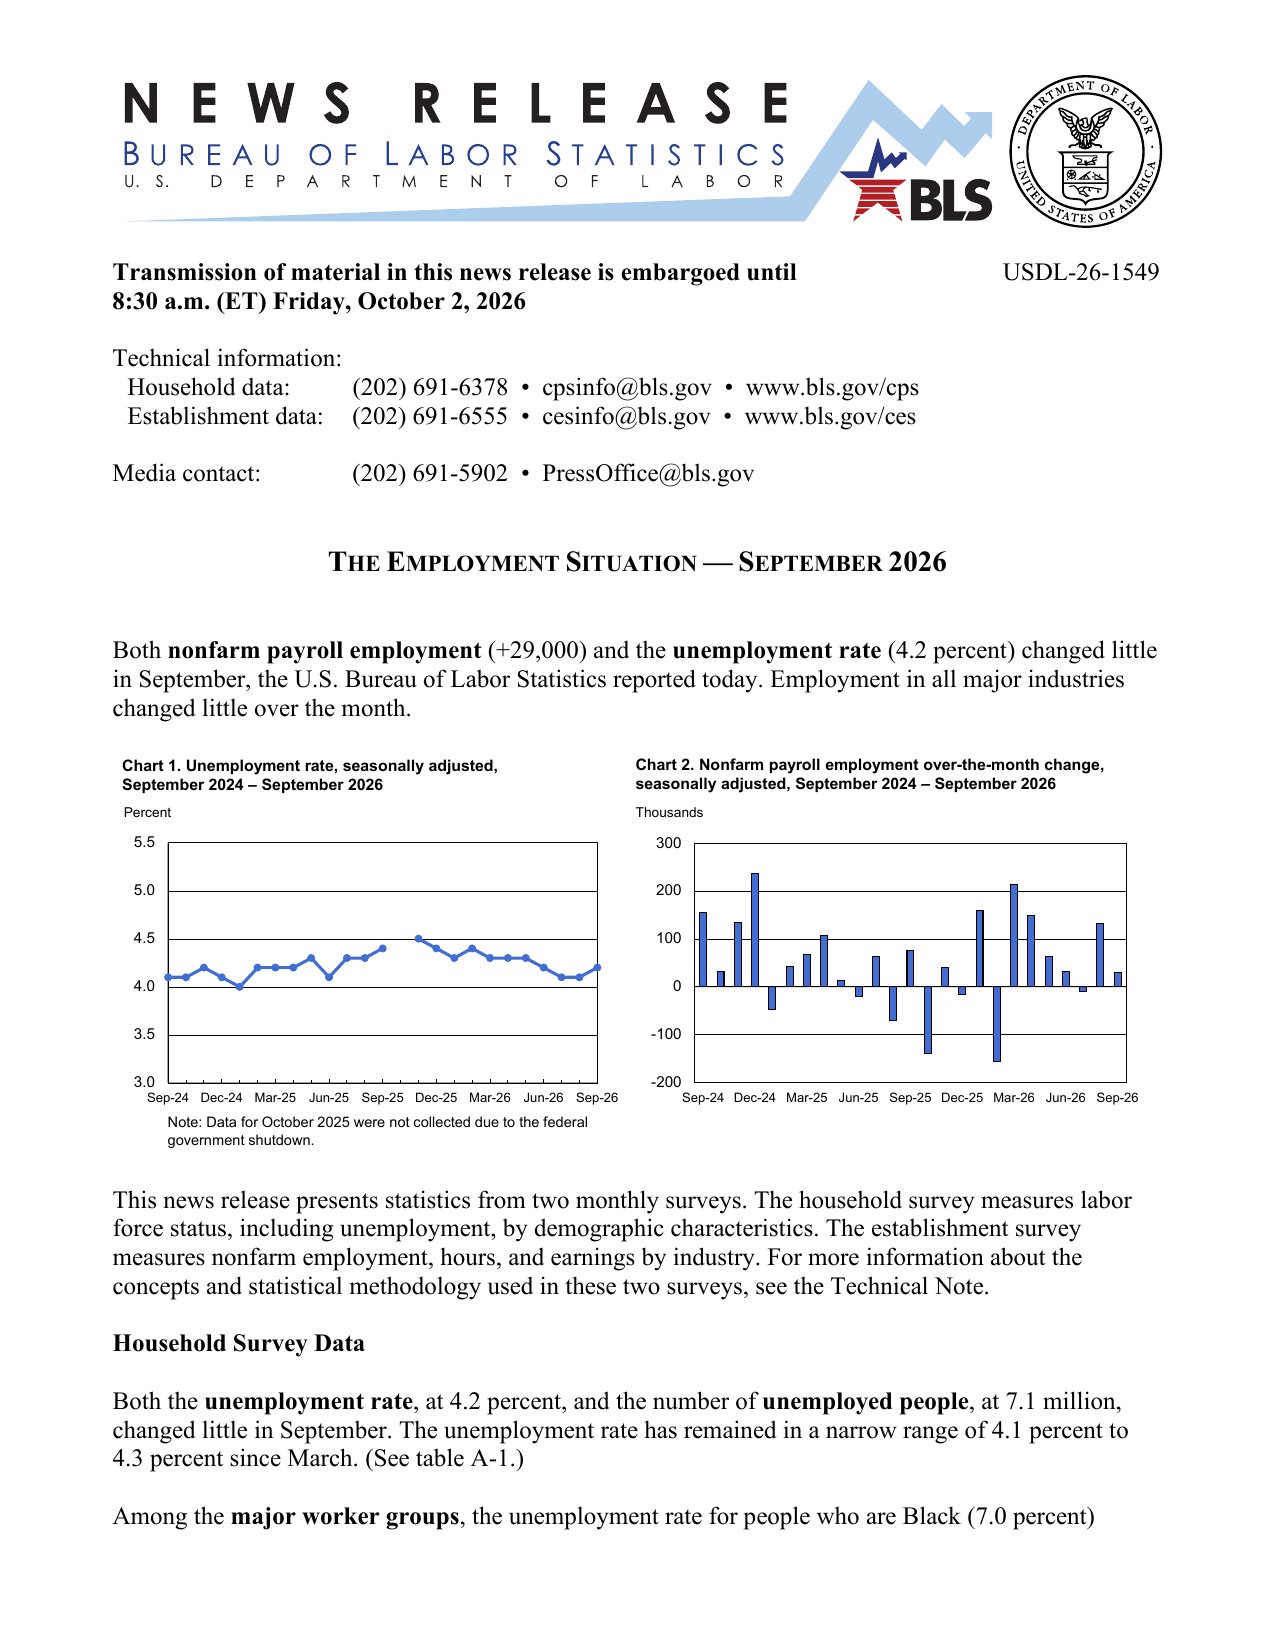
The Bureau of Labor Statistics reported Friday that nonfarm payrolls rose by 29,000 in September and the unemployment rate ticked up to 4.2 percent from 4.1. Economists had expected roughly 90,000 jobs, according to the Associated Press, which also noted this is the last jobs report before the Nov. 3 midterms.
That is a weak month, and nobody should spin it otherwise. But the total is a net figure. Private businesses added 46,000 jobs in September, according to BLS Table B-1, and government at every level cut 17,000. The household survey also found 485,000 more people in the labor force, which pushed participation up to 61.8 percent from 61.6. More people looking for work is part of why the jobless rate rose.
Is the Federal Workforce Really the Smallest Since the 1960s?
White House Deputy Press Secretary Taylor Rogers wrote Friday that "President Trump has shrunk the federal bureaucracy to the lowest levels since the 1960s." We checked that against the monthly BLS federal employment series (CES9091000001) through the agency's public data API, month by month, back to 1960.
It holds. Federal payrolls stood at 2,682,000 in September. The last month with fewer federal workers was May 1966, at 2,663,000, when Lyndon Johnson was in the White House. The figure never dropped that low in the 1970s, 1980s, 1990s, 2000s or 2010s. The low point of the Obama years was 2,728,000 in May 2014.
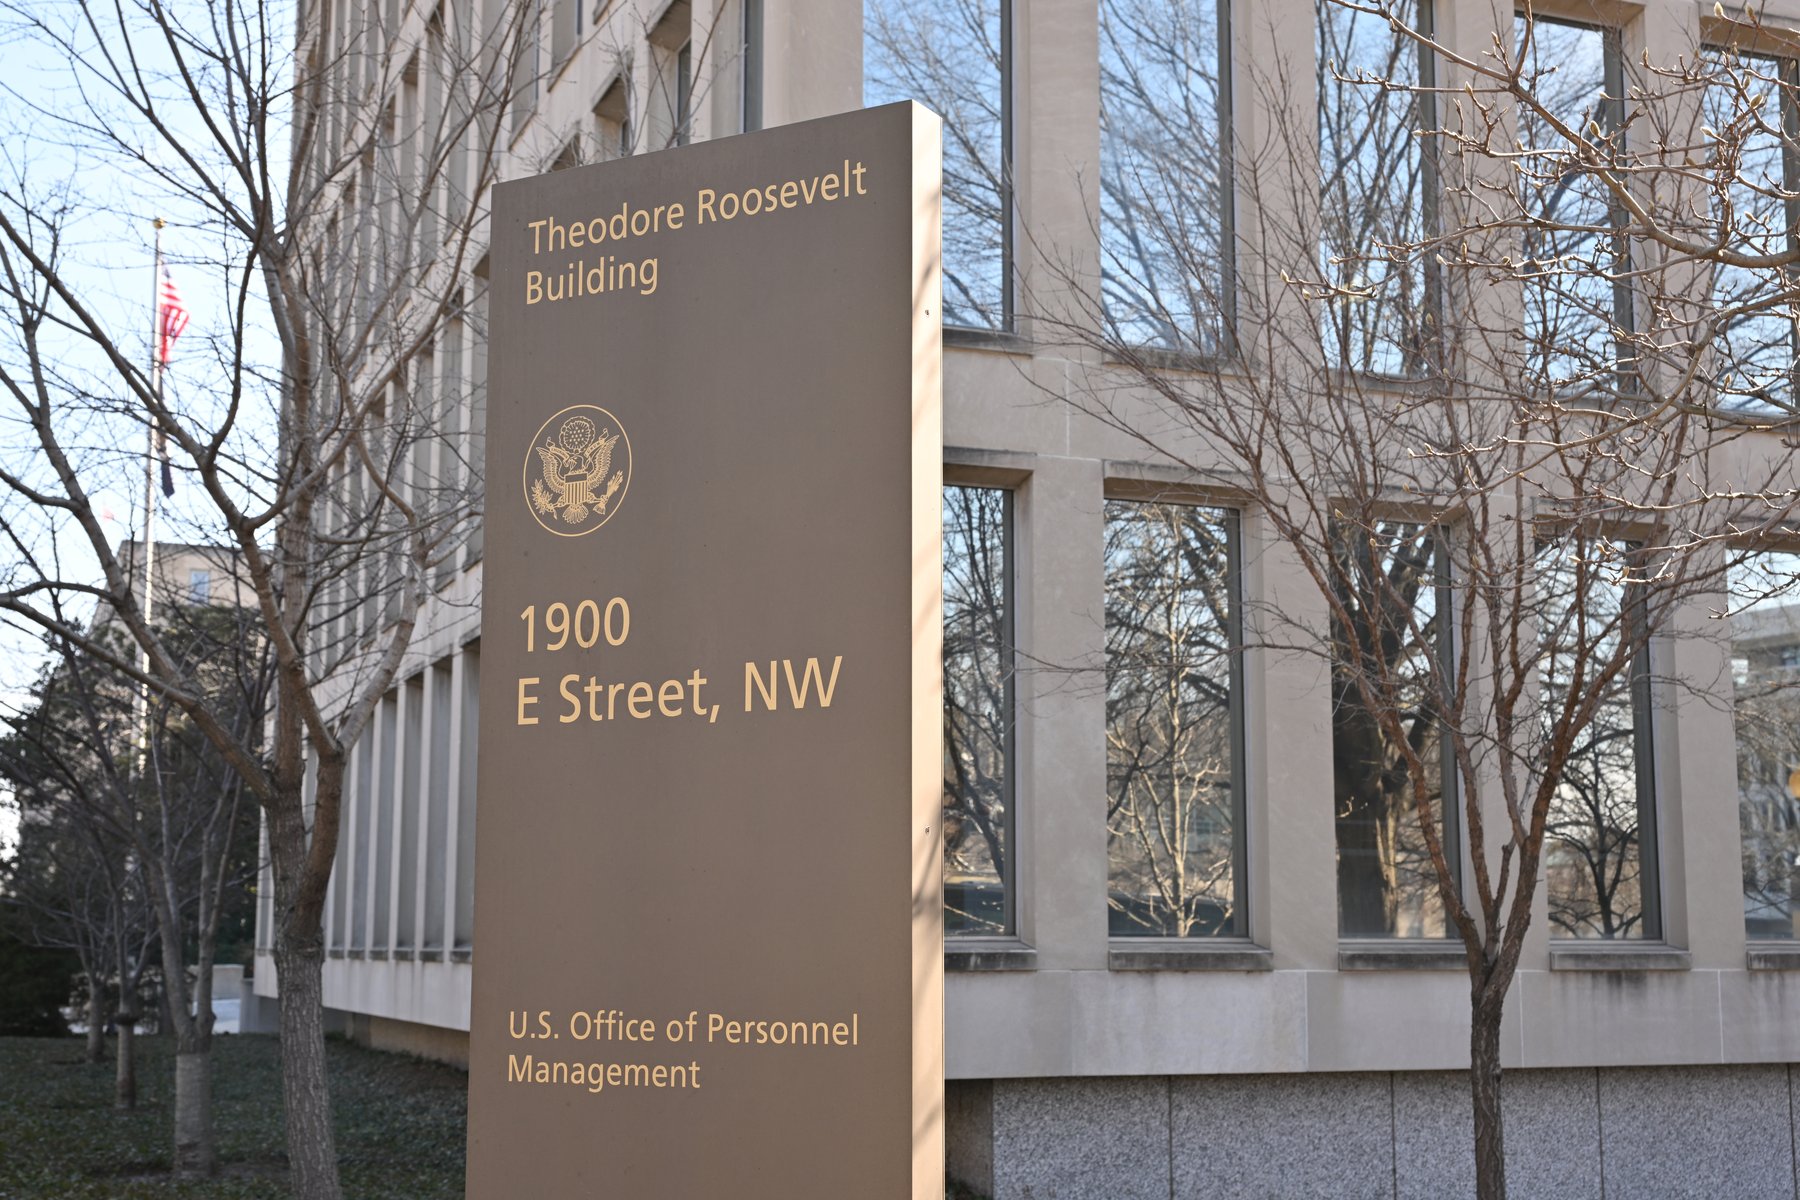
The Theodore Roosevelt Building in Washington, headquarters of the U.S. Office of Personnel Management, the federal government's HR office, photographed Feb. 10, 2025. (Photo: G. Edward Johnson, CC BY 4.0, via Wikimedia Commons)
The drop has been steep. Federal employment was 3,010,000 in January 2025. It is down 328,000 since then, or about 11 percent. Most of that came in 2025, after Trump's February 11 Executive Order 14210 ordered agencies to prepare large-scale reductions in force and to hire no more than one employee for every four who leave. Since January of this year, the federal count has barely moved, sliding from 2,685,000 to 2,682,000.
The Million Private-Sector Jobs Claim Clears the Bar by 6,000
Rogers also wrote that "more than one million private-sector jobs have now been created under President Trump." BLS series CES0500000001 puts private payrolls at 134,711,000 in January 2025 and 135,717,000 in September 2026. That is a gain of 1,006,000.
January is the fair starting line. BLS measures payrolls for the pay period that includes the 12th of the month, and Trump was sworn in on January 20. So the January 2025 figure is Biden's last count, and everything since then belongs to this administration. The claim is accurate, though only barely. One more round of downward revisions the size of this month's would push it back under a million.
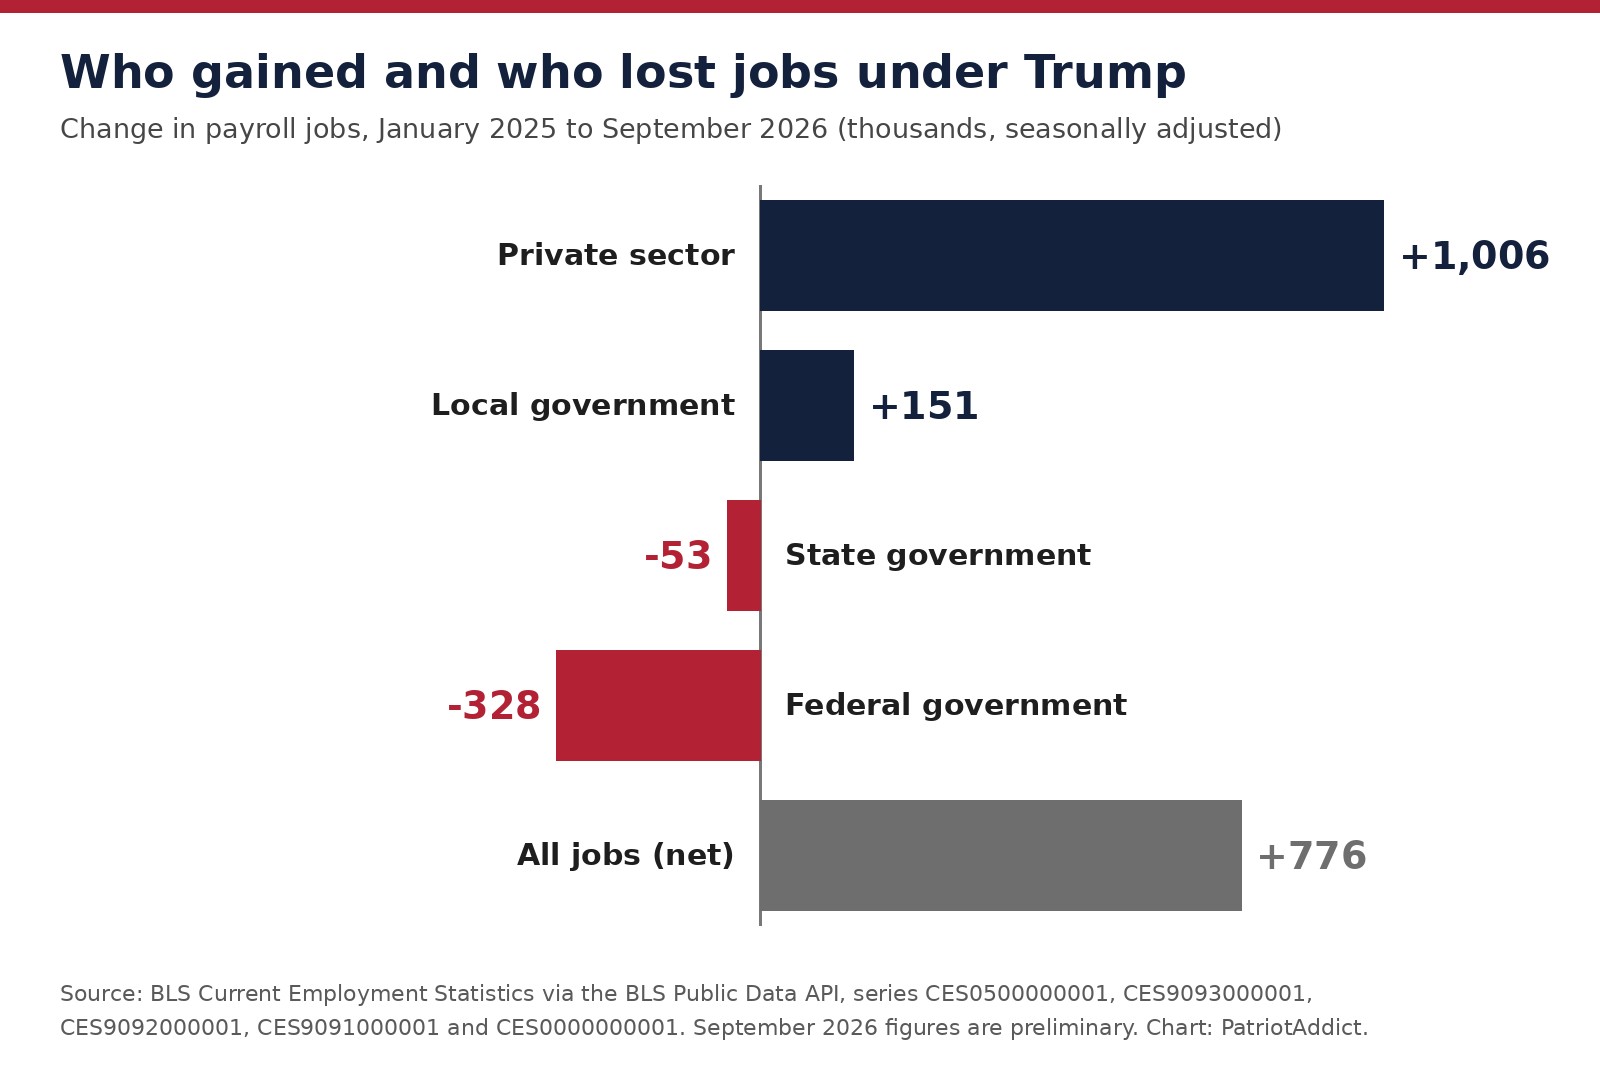
Change in payroll jobs by sector from January 2025 to September 2026, in thousands. Chart built by PatriotAddict from Bureau of Labor Statistics data pulled through the BLS Public Data API; series identifiers are printed on the chart. September figures are preliminary.
City Halls Hired Back Almost Half of What Washington Cut
Here is the part neither side mentioned Friday. While Washington shed 328,000 jobs, local governments added 151,000 over the same stretch, according to series CES9093000001. State governments shrank by 53,000. Add it all up and total government employment is down 230,000 since January 2025, not 328,000.
Most local government work is schools, police and fire, and the BLS table shows local government outside of education still carries about 6.97 million workers. Taxpayers who cheered the federal cuts should know that the payroll savings stop at the county line. Local hiring has eaten close to half of the federal reduction.
The "Factory Construction" Line Needs an Asterisk
The White House statement also said "the economy added 9,000 manufacturing jobs and 12,300 factory construction jobs over the month." The manufacturing number matches the release. BLS says factory employment is up 72,000 from a recent low in December 2025.
The 12,300 figure needs a closer look. It matches the September gain in a Table B-1 line called "nonresidential specialty trade contractors," which counts electricians, plumbers and other trades working on any building that is not a house. That includes factories. It also includes warehouses, hospitals, office towers and data centers, and the table does not break factories out. The broader line for nonresidential building construction rose by only 1,200, and residential specialty contractors lost 7,900. Construction overall added 11,000.
Official record
"The Employment Situation, September 2026," U.S. Bureau of Labor Statistics news release USDL-26-1549, released Oct. 2, 2026 (39 pages).
"The change in total nonfarm payroll employment for July was revised down by 31,000, from +21,000 to -10,000, and the change for August was revised down by 29,000, from +162,000 to +133,000."
BLS Employment Situation release, September 2026
Read or download the full 39-page BLS release (PDF) · view the release on bls.gov
Revisions Took 60,000 Jobs Back, Including August's Big Number
Last month we wrote about August's 162,000 jobs as BLS first reported them. BLS now says it was 133,000. July, first reported as a gain of 21,000, is now a loss of 10,000. Together the two months lost 60,000 jobs on paper.
Average the last three months with the new numbers and hiring is running at about 51,000 a month. That is close to the 45,000 monthly average BLS reports for the prior 12 months. It is not a collapse. It is slow, and it has been slow for a year.
Hourly Pay Trails Prices. Weekly Paychecks Barely Beat Them.
Average hourly earnings for all private workers rose to $37.81, up 3.0 percent from a year earlier, according to Table B-3. The AP called it the smallest yearly gain since May 2021. The latest consumer price index, for August, showed prices up 3.4 percent over 12 months. On an hourly basis, pay is losing.
The picture is less grim for the rank and file. BLS tracks production and nonsupervisory workers separately in Table B-8, and their hourly pay rose 3.3 percent to $32.60. Because their workweek also stretched slightly, their average weekly paycheck rose from $1,063.57 to $1,101.88. That is a 3.6 percent raise, a hair ahead of 3.4 percent inflation. One caution: September prices are not out yet, so this compares September pay with August prices.
What It Means Five Weeks Before the Midterms
Democrats wasted no time. "Another bad jobs report," Rep. Ted Lieu of California posted Friday, adding "November is coming." The economy will be on the ballot, and the AP cites an AP-NORC poll finding only 17 percent of adults approve of Trump's handling of the cost of living.
Read the tables instead of the headlines, and the September report says something more specific than "bad." The federal government is the smallest it has been in 60 years, and the private sector has grown by a million jobs since Trump took over. Weekly pay for working Americans is just barely keeping pace with prices, while energy costs are up 16.3 percent over the year. The weak spot is the pace of new hiring, and the October report, due November 6, lands three days after the votes are counted.
Top photo: President Donald Trump and Elon Musk in the Oval Office on Feb. 11, 2025, the day Trump signed Executive Order 14210 on federal workforce reductions. (Official White House photo by Daniel Torok, public domain, via Wikimedia Commons; child's face blurred by Wikimedia Commons contributor)