The Census Bureau and HUD put new single-family home sales at a 607,000 annual rate in July, down 10.5 percent from June and the weakest reading since January. The Conference Board's confidence index fell to a seven-month low the same morning. Then read the fine print Census attaches to its own numbers, and almost the entire report dissolves.
The headline number comes with a range, and the range contains zero
Sales of new single-family houses ran at a seasonally adjusted annual rate of 607,000 in July, according to release CB26-128, published jointly by Census and the Department of Housing and Urban Development at 10 a.m. Eastern Tuesday. That is 10.5 percent below June and 6.3 percent below July 2025. Economists polled by Reuters had looked for 620,000, per Dan Burns' wire story.
Census does not print that 10.5 percent on its own. It prints it as 10.5 percent plus or minus 14.0 percentage points, a 90 percent confidence interval. Work that out against June's 678,000 and the actual July rate could plausibly be anywhere from 511,900 to 701,700. June sits inside that range. By the Census Bureau's own published test, the drop that led every wire story on Tuesday is not statistically distinguishable from no change at all.
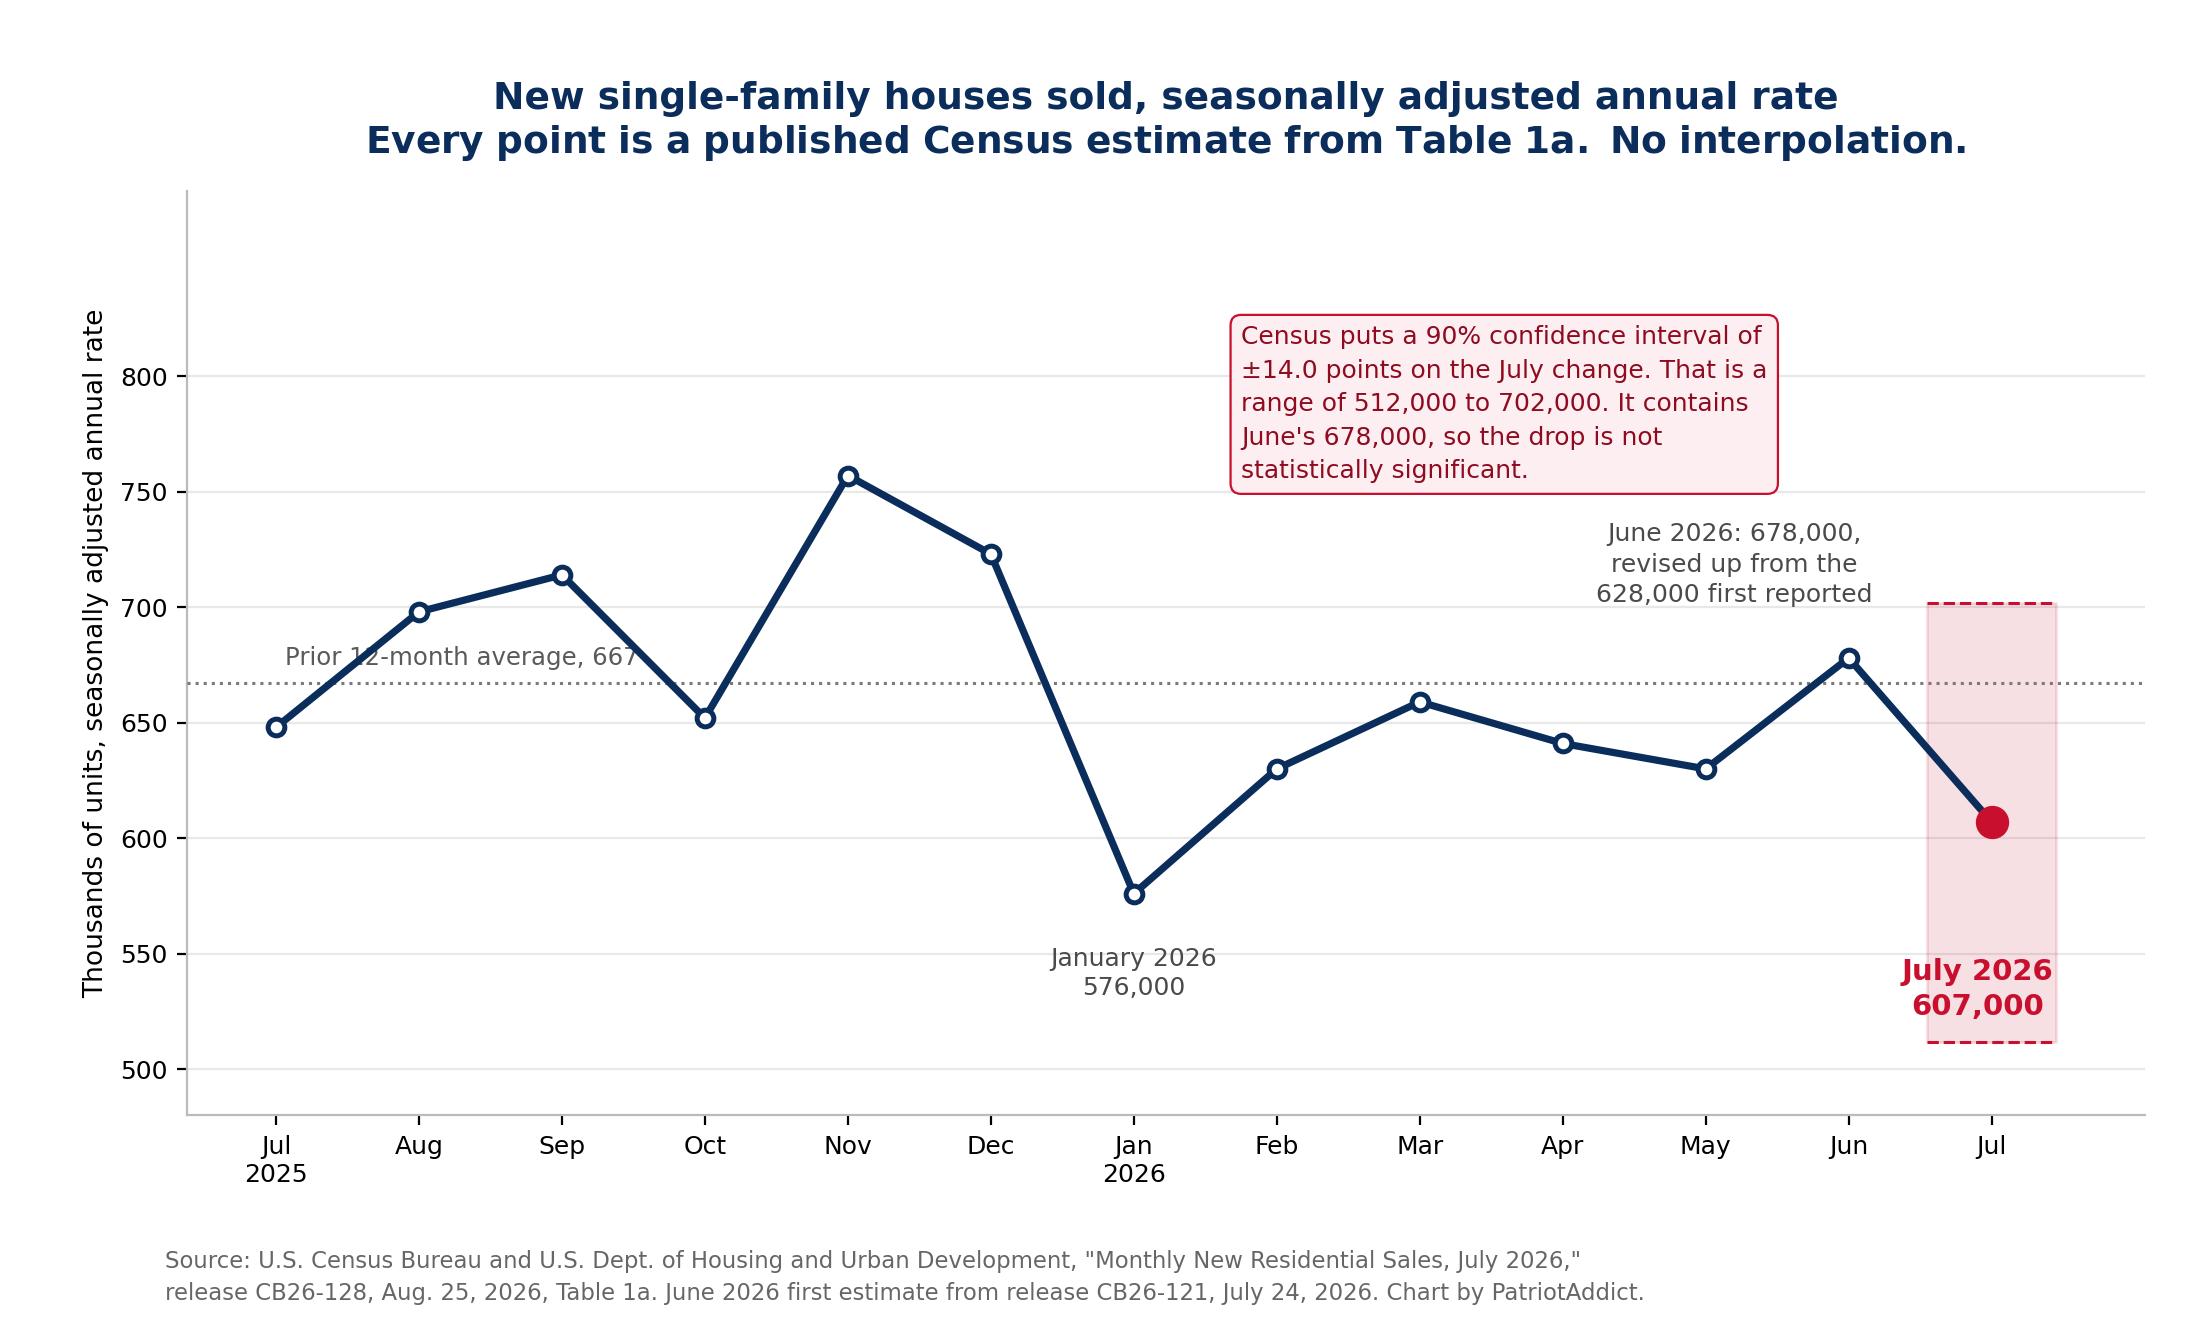
Chart built by PatriotAddict from Table 1a of the Census Bureau and HUD release "Monthly New Residential Sales, July 2026" (CB26-128, Aug. 25, 2026), with the June 2026 first estimate taken from the prior release, CB26-121 of July 24. Every point is a published Census estimate. Nothing is interpolated. The shaded band is the 90 percent confidence interval Census itself attaches to the July change.
Official record
U.S. Census Bureau and U.S. Department of Housing and Urban Development, Monthly New Residential Sales, July 2026, release number CB26-128, issued 10:00 a.m. EDT Tuesday, August 25, 2026. Five pages. Release page on census.gov.
"All ranges given for percent changes are 90-percent confidence intervals and account only for sampling variability. If a range does not contain zero, the change is statistically significant. If it does contain zero, the change is not statistically significant; that is, it is uncertain whether there was an increase or decrease." — CB26-128, Explanatory Notes, page 2
Page 3 carries Table 1a, the table that does the work. Under every percent change sits the interval, and next to the ones that fail the test sits an asterisk, defined at the bottom of page 2 as "insufficient statistical evidence to conclude that the actual change is different from zero." The headline sales figure carries that asterisk. So does the year-over-year figure, the months' supply change, the median price change, and the average price change.
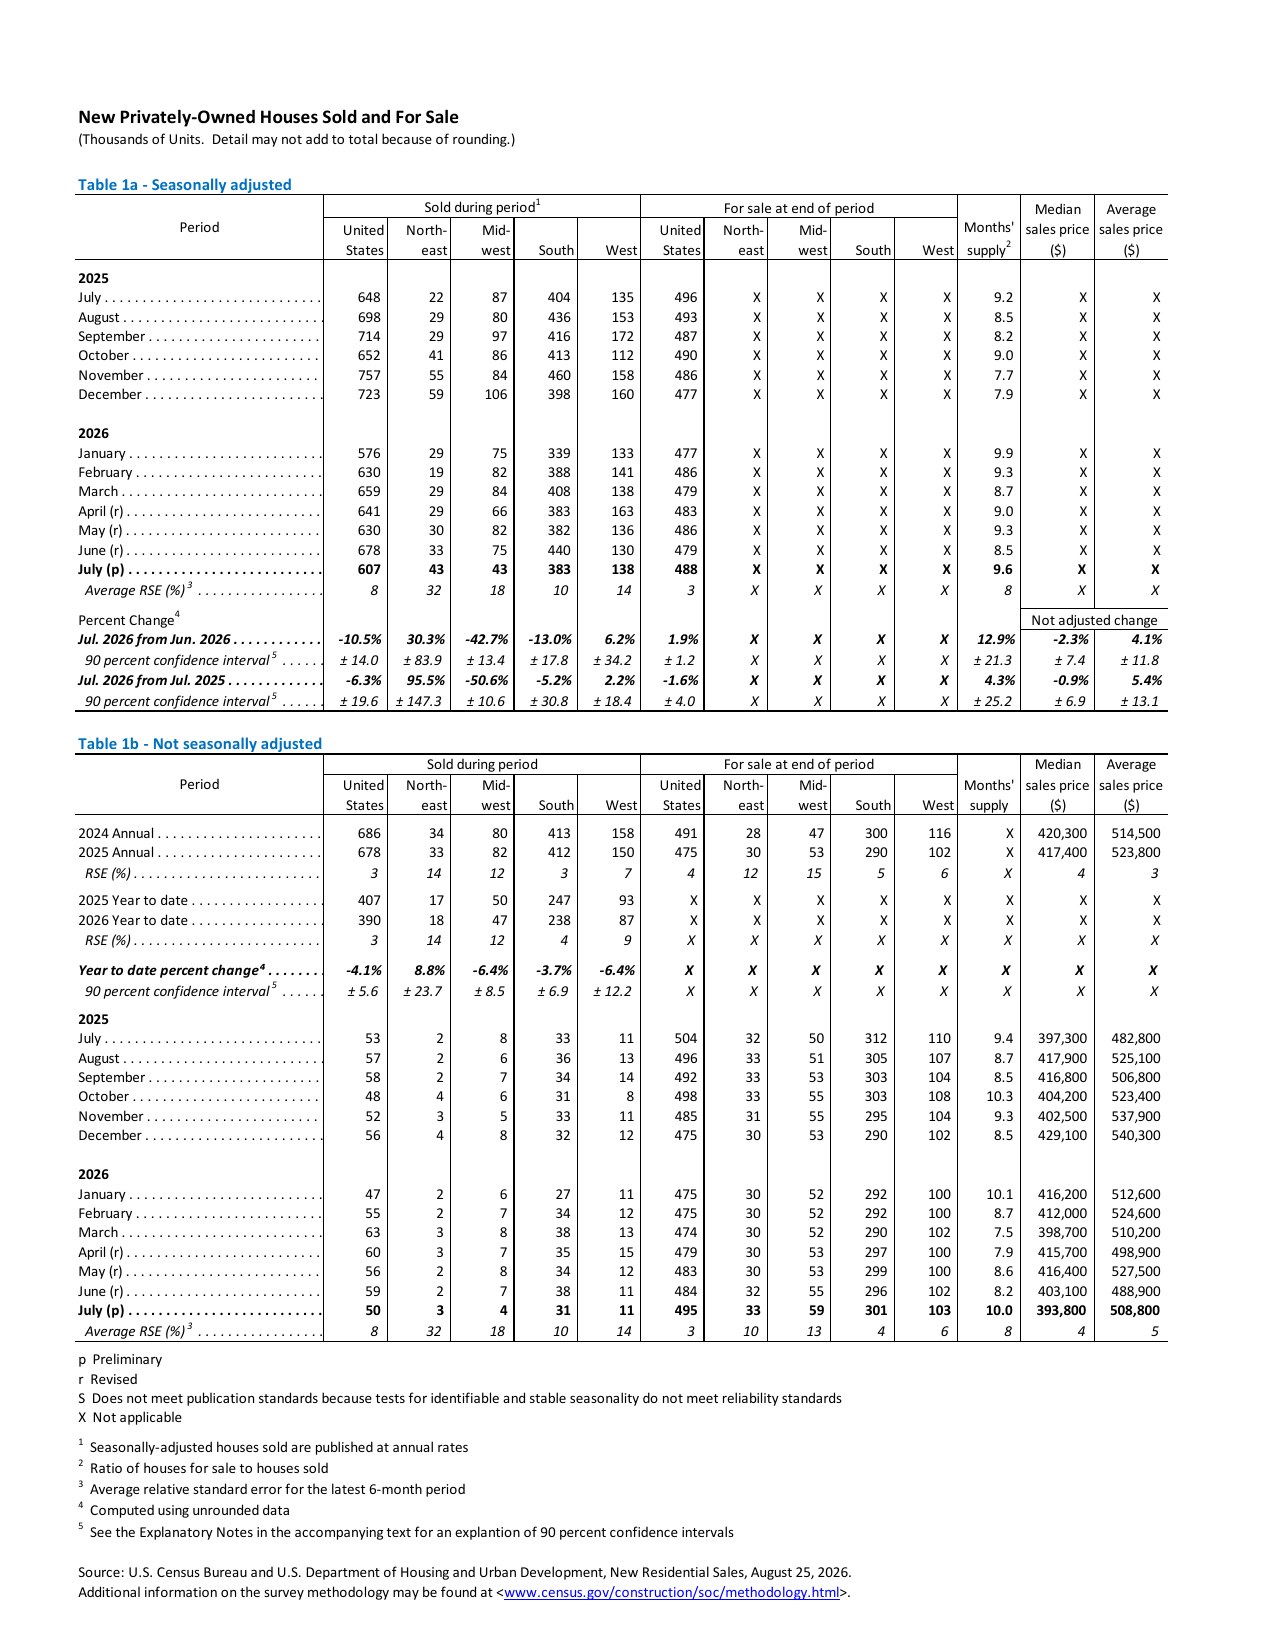
Read or download the full 5-page release (PDF) · Census survey methodology
Most of the 10.5 percent came from revising June upward, not from July
A month ago, Census reported June new home sales at 628,000. That was release CB26-121, dated July 24. Tuesday's release revised June to 678,000, a 50,000 upgrade to a number that was six weeks old.
Measure July's 607,000 against the June figure the country actually saw at the time and the decline is 3.3 percent, not 10.5. Neither version is wrong. They are just different arithmetic, and the bigger one got the headlines. Census warns about exactly this on page 2: "On average, the preliminary seasonally adjusted estimate of total sales is revised about 5.0 percent," and "It takes 4 months to establish a trend for new houses sold."
The steadier read sits in Table 1b. Year to date, 390,000 new houses have sold against 407,000 over the same stretch of 2025, a decline of 4.1 percent. The confidence interval on that is plus or minus 5.6 points. It also contains zero.
Three numbers in the whole release cleared the bar. Here they are.
Run the test across every change Census published Tuesday and exactly three come out statistically significant. None of the three is the one that made the news.
The first is inventory. The seasonally adjusted count of new houses for sale hit 488,000 at the end of July, up 1.9 percent from June's 479,000, with an interval of plus or minus 1.2 points. That range excludes zero. It is the highest for-sale count since October 2025, and it lifted months' supply to 9.6 from 8.5. Builders are not selling into a shortage. They are accumulating unsold houses.
The other two are regional, and they are severe. Midwest new home sales fell to a 43,000 annual rate from 75,000 in June, down 42.7 percent with an interval of plus or minus 13.4 points, and down 50.6 percent from July 2025 with an interval of plus or minus 10.6. Both clear the bar comfortably. Midwest new home sales have been cut in half in a year. The unadjusted Midwest count for July was 4,000 houses, so the sample behind that estimate is small, which is why Census reports an average relative standard error of 18 percent for the region. It still passed its own test twice.
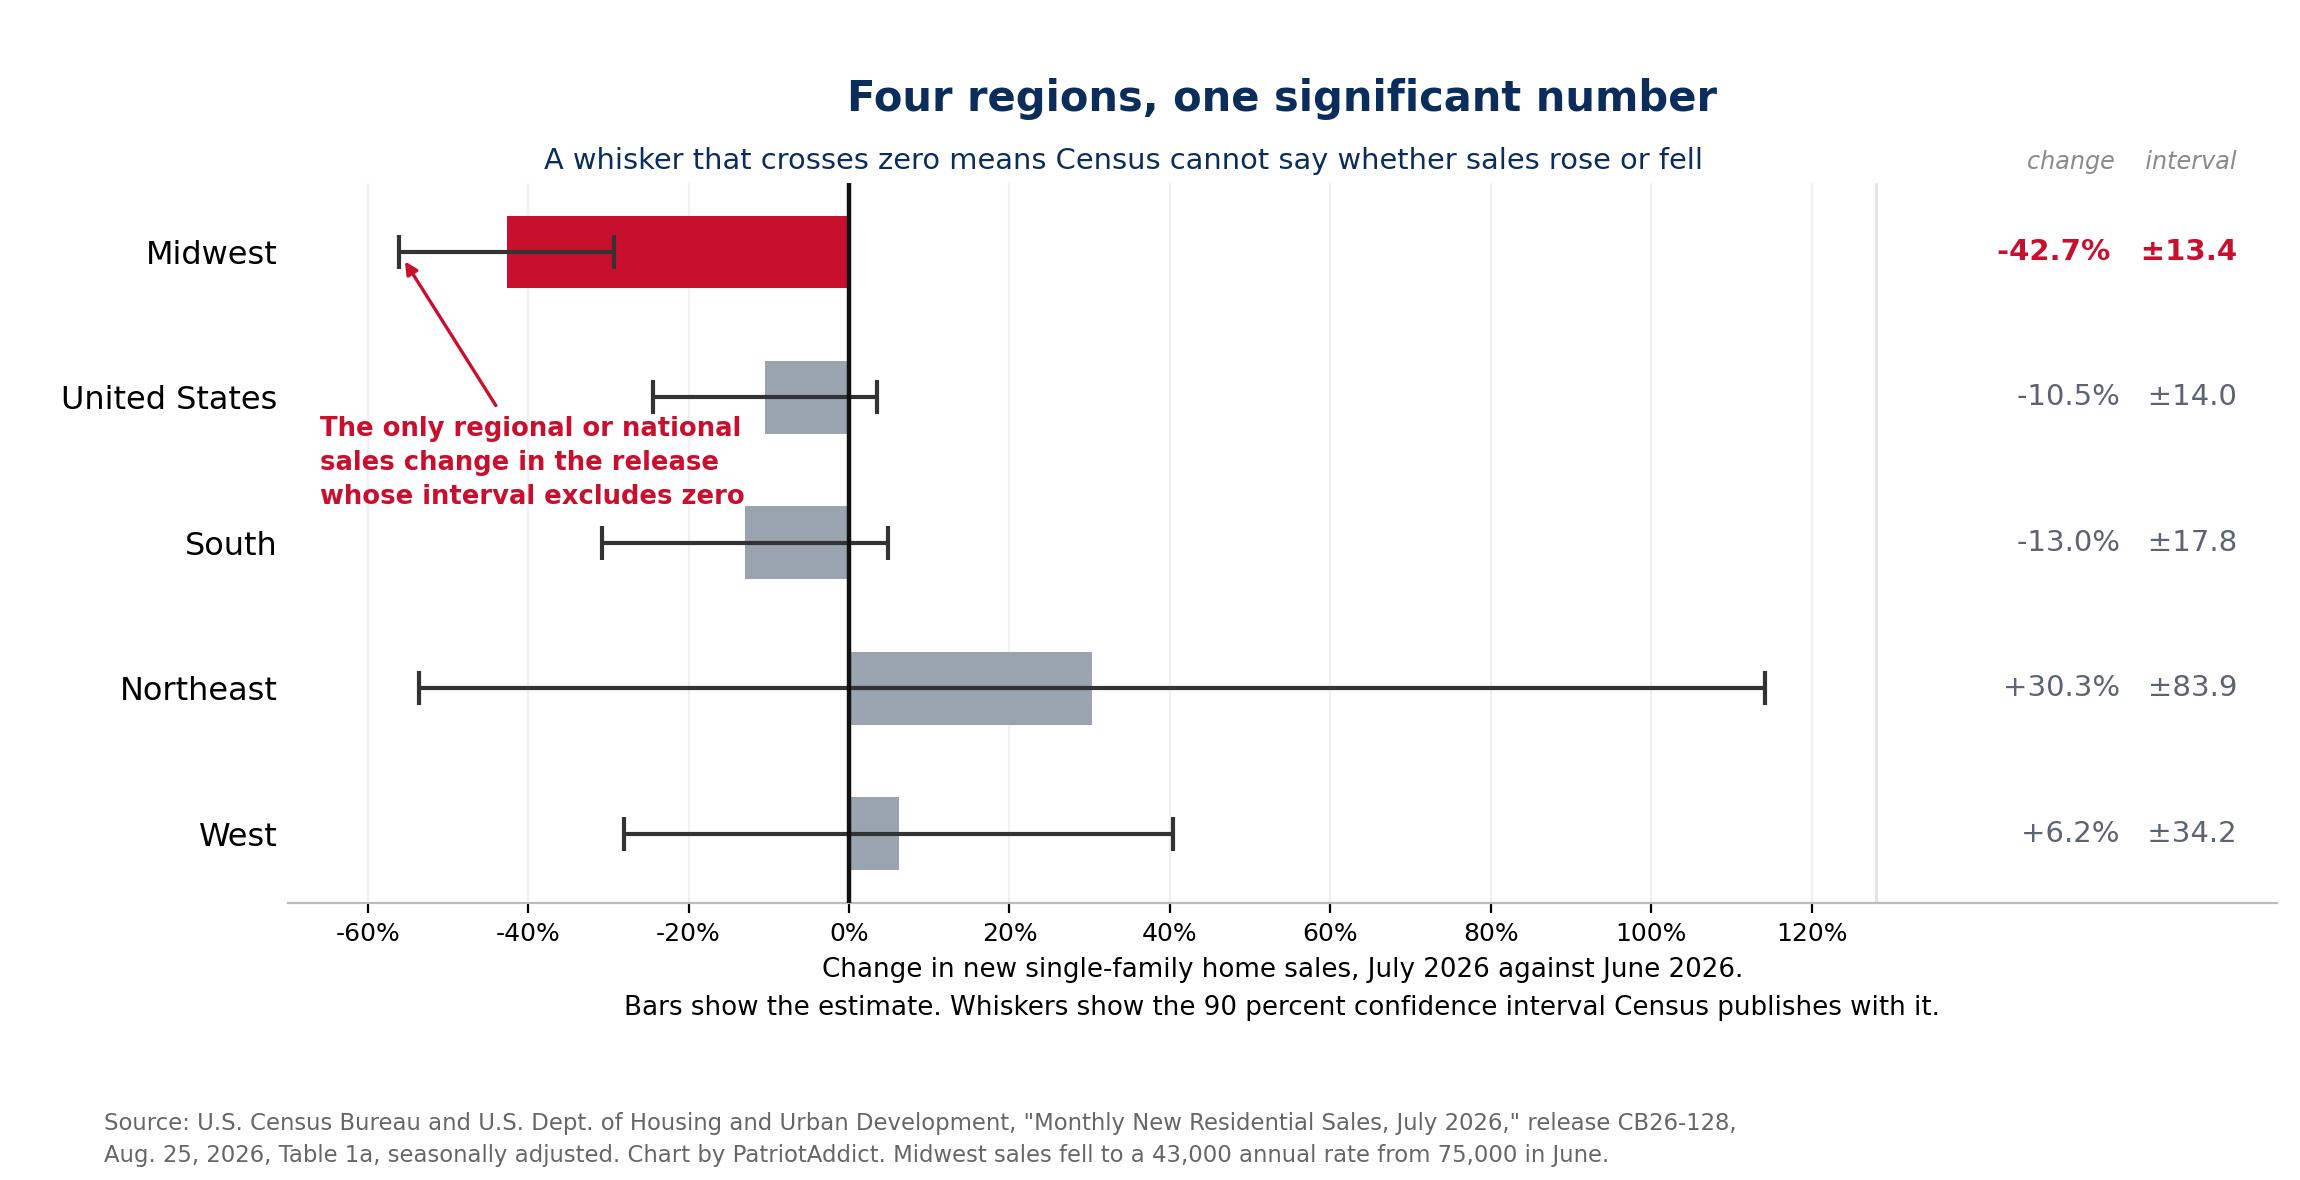
Chart built by PatriotAddict from Table 1a of Census release CB26-128, seasonally adjusted, August 25, 2026. The bars are the published estimates and the whiskers are the 90 percent confidence intervals Census prints beside them. The Northeast whisker runs from minus 53.6 to plus 114.2 percent, which is another way of saying the survey learned nothing about the Northeast last month.
The price side is the part actually moving toward the buyer
The median new house sold for $393,800 in July, down from $403,100 in June and $397,300 a year earlier. That is the lowest monthly median in the thirteen months Census prints. Both declines carry asterisks, so neither is statistically firm, but the direction has been consistent since March and it is the direction a buyer wants.
Existing-home prices tell a more divided story, and Tuesday's Case-Shiller release is where most coverage got a number wrong. The national index rose 1.5 percent over the year through June, up from 1.2 percent in May. The 2.1 percent figure that circulated all day belongs to the 20-city composite, which rose from 1.6 percent. The 10-city composite gained 2.9 percent. Those are three different indexes measuring three different slices of the country, and the broadest of them is the slowest.
Rebecca Kaufman, Associate Director of Commodities at S&P Dow Jones Indices, put the real-terms math in her own release: June inflation of 3.5 percent against a 1.5 percent price gain, the thirteenth straight month in which American home values fell after inflation. The full release is on press.spglobal.com. Note for anyone checking behind us: the main spglobal.com index pages return a 403 security interstitial to automated requests, so the press-release host is the one that works.
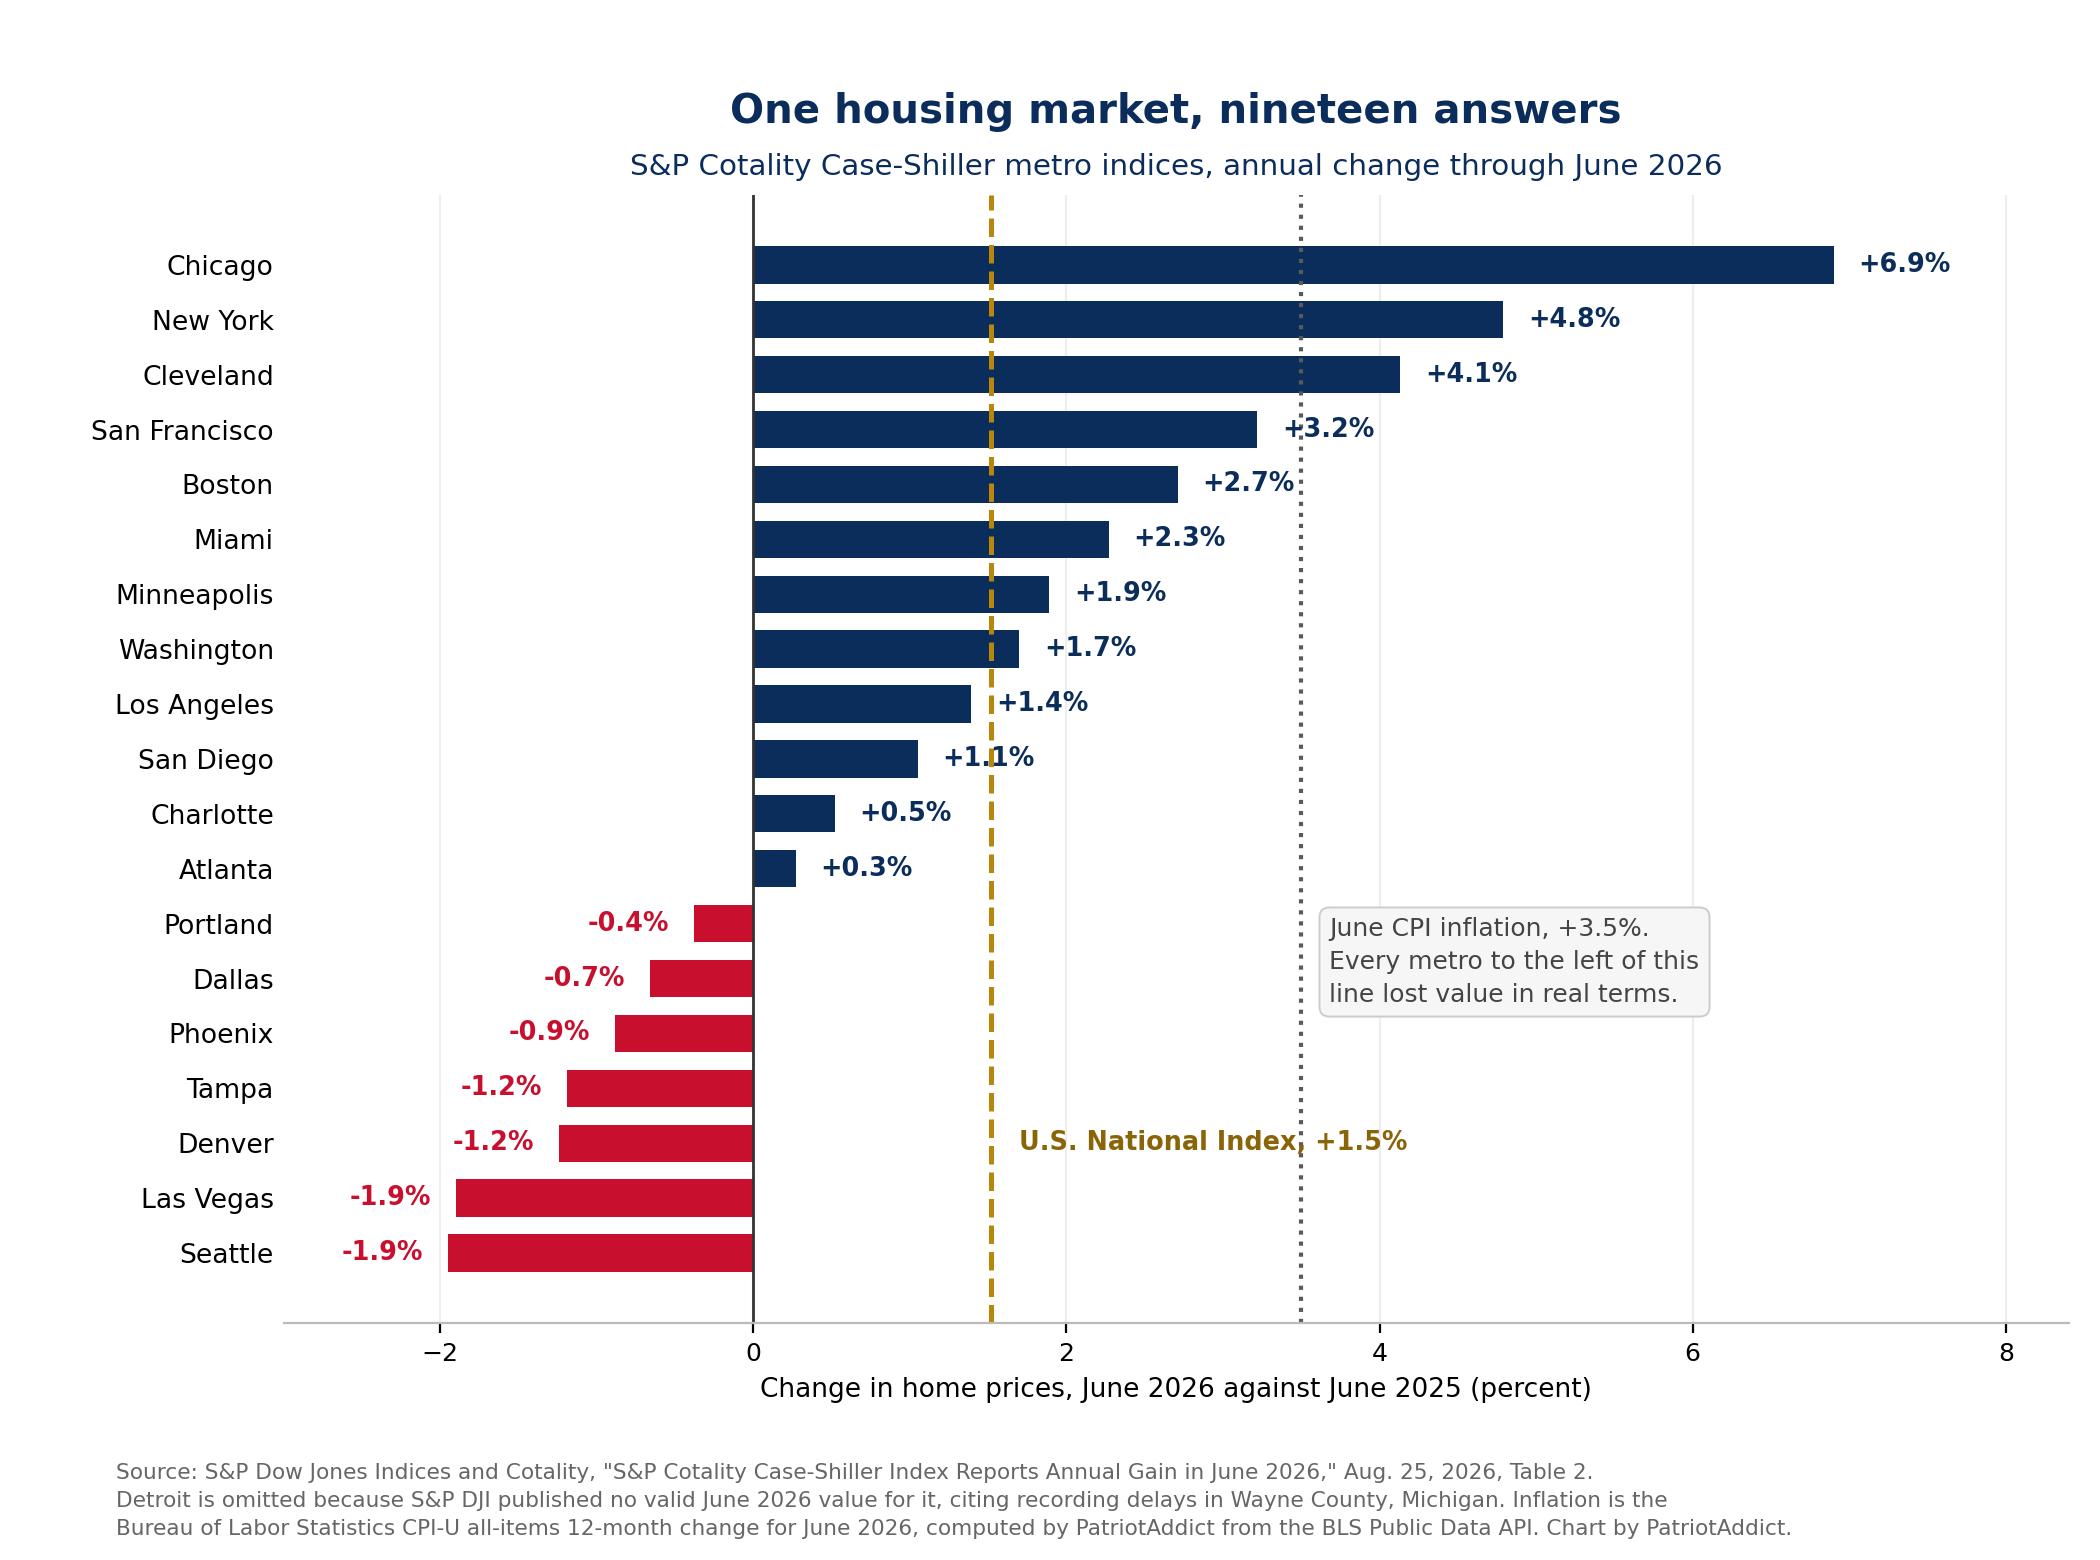
Chart built by PatriotAddict from Table 2 of the S&P Cotality Case-Shiller June 2026 release of Aug. 25, 2026. Detroit is left out because the index publisher issued no valid June value for it, citing recording delays in Wayne County, Michigan. The inflation line is the Bureau of Labor Statistics CPI-U all-items 12-month change for June 2026, computed by PatriotAddict from index values pulled through the BLS Public Data API.
Look at which cities are winning. Chicago led every metro at 6.9 percent, its fourth month in a row on top, followed by New York at 4.8 and Cleveland at 4.1. Seattle fell 1.95 percent, the steepest of the nineteen metros that got a June value, with Las Vegas at 1.90 and Denver at 1.24 behind it. Dallas, Phoenix, Tampa and Portland are all negative too. The places people spent five years moving to are the places where prices are now falling, and the Midwest and Northeast markets they left are the ones appreciating.
The government's own price series agrees on direction and disagrees on speed. The Federal Housing Finance Agency reported Tuesday that house prices rose 2.1 percent between the second quarter of 2025 and the second quarter of 2026, up 0.3 percent for the quarter, with its monthly June index flat against May. Prices rose in 46 states and the District of Columbia. New Mexico fell hardest at 1.2 percent. Everett, Washington was the worst of the 100 largest metros at 3.7 percent down.
Confidence fell where it always falls: the part about six months from now
The Conference Board's Consumer Confidence Index came in at 89.4 for August, down 0.8 points from a July reading that was itself revised down to 90.2 from the 90.8 first reported. Reuters called it the lowest in seven months, which means the lowest since January, when the index printed 84.5.
The composition matters more than the headline. The Present Situation Index rose 6.8 points to 121.2, its first improvement in four months. The Expectations Index fell 5.8 points to 68.2. Every component of Expectations weakened: business conditions to a net minus 6.3 percent, the labor market outlook to minus 11.5, household income down 3.1 points but still positive at plus 3.8.
The 80 line is worth being precise about, because coverage attributed it to the Conference Board and the Conference Board did not say it Tuesday. In its own January release the organization described the Expectations Index as "well below the threshold of 80 that usually signals a recession ahead." August's release contains no such sentence. What it says instead is that while the share of consumers calling a recession "very likely" ticked up, "consumers still perceived a low likelihood of a recession in 12 months."
Chief economist Dana M Peterson stayed narrow: "Consumer appraisals of current business conditions were mildly positive. Perceptions of the current labor market improved, reversing three months of moderate decline." The survey ran August 3 through 16. Over those two weeks the Energy Information Administration priced regular gasoline at $4.079 and $4.006 a gallon, and the Conference Board recorded that write-in references to prices "and oil and gas specifically" stayed elevated. EIA's August 24 reading, posted since our piece yesterday, came in at $4.085.
Breitbart's John Carney read the split politically, and the Conference Board's own demographic table supports the premise: confidence softened among Republicans and independents while Democrats turned more positive, 70 days out from the midterms. That is a real pattern in the data. It is also a reminder that a survey of feelings about the next six months is not the same instrument as a count of closed contracts.
Why a soft data day does not lower your mortgage rate
Freddie Mac's Primary Mortgage Market Survey put the 30-year fixed rate at 6.65 percent for the week ended August 20, down from 6.67 the week before and a second straight weekly decline. That is progress measured in two basis points. Pull Freddie Mac's own weekly history file, which runs back to 1971, and the year looks different: the 30-year averaged 6.06 percent in the week of January 15 and bottomed at 5.98 percent on February 26. It has climbed 67 basis points since, and peaked at 6.69 percent on August 6.
Reuters dates the turn to late February, when the United States and Israel struck Iran, oil moved, and inflation followed. The same story put the Mortgage Bankers Association's 30-year contract rate at 6.77 percent for the week ended August 14. Both numbers describe the same mechanism, which runs through the long end of the Treasury curve rather than through the Federal Reserve's policy rate.
Tuesday's data did move that curve. Treasury's daily par yield figures show the 30-year bond closing at 5.17 percent and the 10-year at 4.64, down from 5.23 and 4.70 on Monday. The bond market took the housing and confidence numbers as evidence of weakness and bid yields down. Six basis points in a day is not a refinance. It is a hint of one, and it is the only lever in this story that acts on a mortgage quickly.
The Fed itself has not moved its policy rate since December, by Reuters' count. Three officials voted in July to raise rates rather than hold them, and the July minutes recorded that "many participants assessed that policy tightening would likely be necessary if inflation did not decline." We laid out that box yesterday, and nothing Tuesday changed its walls.
The administration's case, at full strength and then qualified
The White House has a housing record to point at, and parts of it are holding up. Executive Order 14394, signed March 13, ordered the Army Corps and EPA to rewrite stormwater and Clean Water Act Section 404 permitting to cut construction costs, told Commerce, HUD, Transportation and FHFA to strip rules that constrain single-family and exurban development, and directed the Council on Environmental Quality to maximize NEPA categorical exclusions for housing. A January 14 release added the two market-side moves: directing Fannie Mae and Freddie Mac to buy $200 billion in mortgage-backed securities, and acting to bar large institutional investors from buying single-family homes.
On the merits, several things are genuinely working. New house prices are falling in nominal terms. Home values nationally have fallen in real terms for thirteen consecutive months, which is the arithmetic of affordability improving. Inventory is the highest since October and months' supply is near a one-year high, which means choice and negotiating room. The Conference Board's labor market differential, the share of consumers saying jobs are plentiful minus the share saying jobs are hard to get, rose 4.8 points to plus 7.5 percent, the widest gap of the year, off a July reading Reuters called the lowest in more than five years. And builders are not retrenching: residential building construction payrolls rose to 1,867,900 in July, tied for the highest of 2026, computed from Bureau of Labor Statistics series CES2023600001. Tariff receipts are also real money, with customs duties of $24.83 billion in July per Treasury's Monthly Treasury Statement.
Now the qualifiers, in the same breath. The January release's central boast was that "the average 30-year fixed mortgage rate has dipped to multi-year lows." Freddie Mac had it at 6.06 percent that week. It is 6.65 now. The same release said home sales were "gaining momentum" on the strength of a December existing-home number; new home sales have printed below that December rate in all seven months since. Total nonfarm payrolls fell by 23,000 in July, from 158,881,000 to 158,858,000, the second monthly decline this year. And shelter costs are still outrunning pay: shelter CPI rose 3.18 percent over the twelve months through July while average hourly earnings rose 3.15 percent, both computed here from BLS index values through the BLS Public Data API, because bls.gov refuses scripted requests.
The deeper problem is a matter of what each tool touches. Permitting reform and NEPA exclusions act on supply, and supply arrives in years. A directive to buy mortgage-backed securities compresses the spread between the mortgage rate and the Treasury yield. Neither one sets the Treasury yield. That is priced by a bond market looking at five-plus years of above-target inflation and a war that closed the Strait of Hormuz.
One more soft print, and what lands next

The Census Bureau headquarters in Suitland, Maryland, where the New Residential Sales survey is compiled from a sample of building permits. File photo taken March 2007 by the U.S. Census Bureau, public domain. The next new home sales release, covering August, is scheduled for September 24, 2026.
Tuesday's cluster had a fourth member that got almost no attention. The Federal Reserve Bank of Richmond reported its composite manufacturing index slipping from 5 to 4, with new orders down to 3 from 5 and employment turning negative at minus 2 from plus 2. Local business conditions fell from 10 to 4. The bank's own summary line, in the August 25 report, was that activity "changed little." Prices paid and prices received both accelerated.
The Bureau of Economic Analysis publishes Personal Income and Outlays for July at 8:30 a.m. Eastern Wednesday, August 26, carrying the PCE price index the Fed actually targets. It was still unpublished when this piece went up, and BEA's own schedule is the place to check. Census releases August new home sales on September 24. The Conference Board's next confidence reading is September 29, the same day FHFA publishes July house prices. The Federal Open Market Committee meets September 15 and 16 with a fresh Summary of Economic Projections attached.
Here is the honest shape of Tuesday. One housing report that mostly failed its own significance test, one confidence survey that fell entirely on expectations while current conditions improved, one price index whose headline number most coverage swapped for a different one, and one regional manufacturing survey that barely moved. The three figures that did clear the statistical bar all point the same way: unsold new houses piling up, and Midwest sales cut in half. Neither of those is a story about how Americans feel. Both are a story about a 6.65 percent mortgage, and nobody in Washington sets that number directly.