The national unemployment rate held at 4.2 percent in September, but the Bureau of Labor Statistics' new state-by-state release shows a lopsided map. Only California and Michigan, plus the District of Columbia, have jobless rates statistically above the nation, and 43 states have added no meaningful number of jobs in a year.
What does the BLS state report actually say?
The Bureau of Labor Statistics published its State Employment and Unemployment release on Tuesday, October 20. The national rate "changed little both over the month and over the year," in the agency's words. Most coverage stops there.
The state tables go further. Twenty states have rates below the national figure, two states and the District have higher rates, and 28 states are not appreciably different, per the same release. South Dakota is lowest at 2.0 percent and North Dakota is next at 2.2 percent.
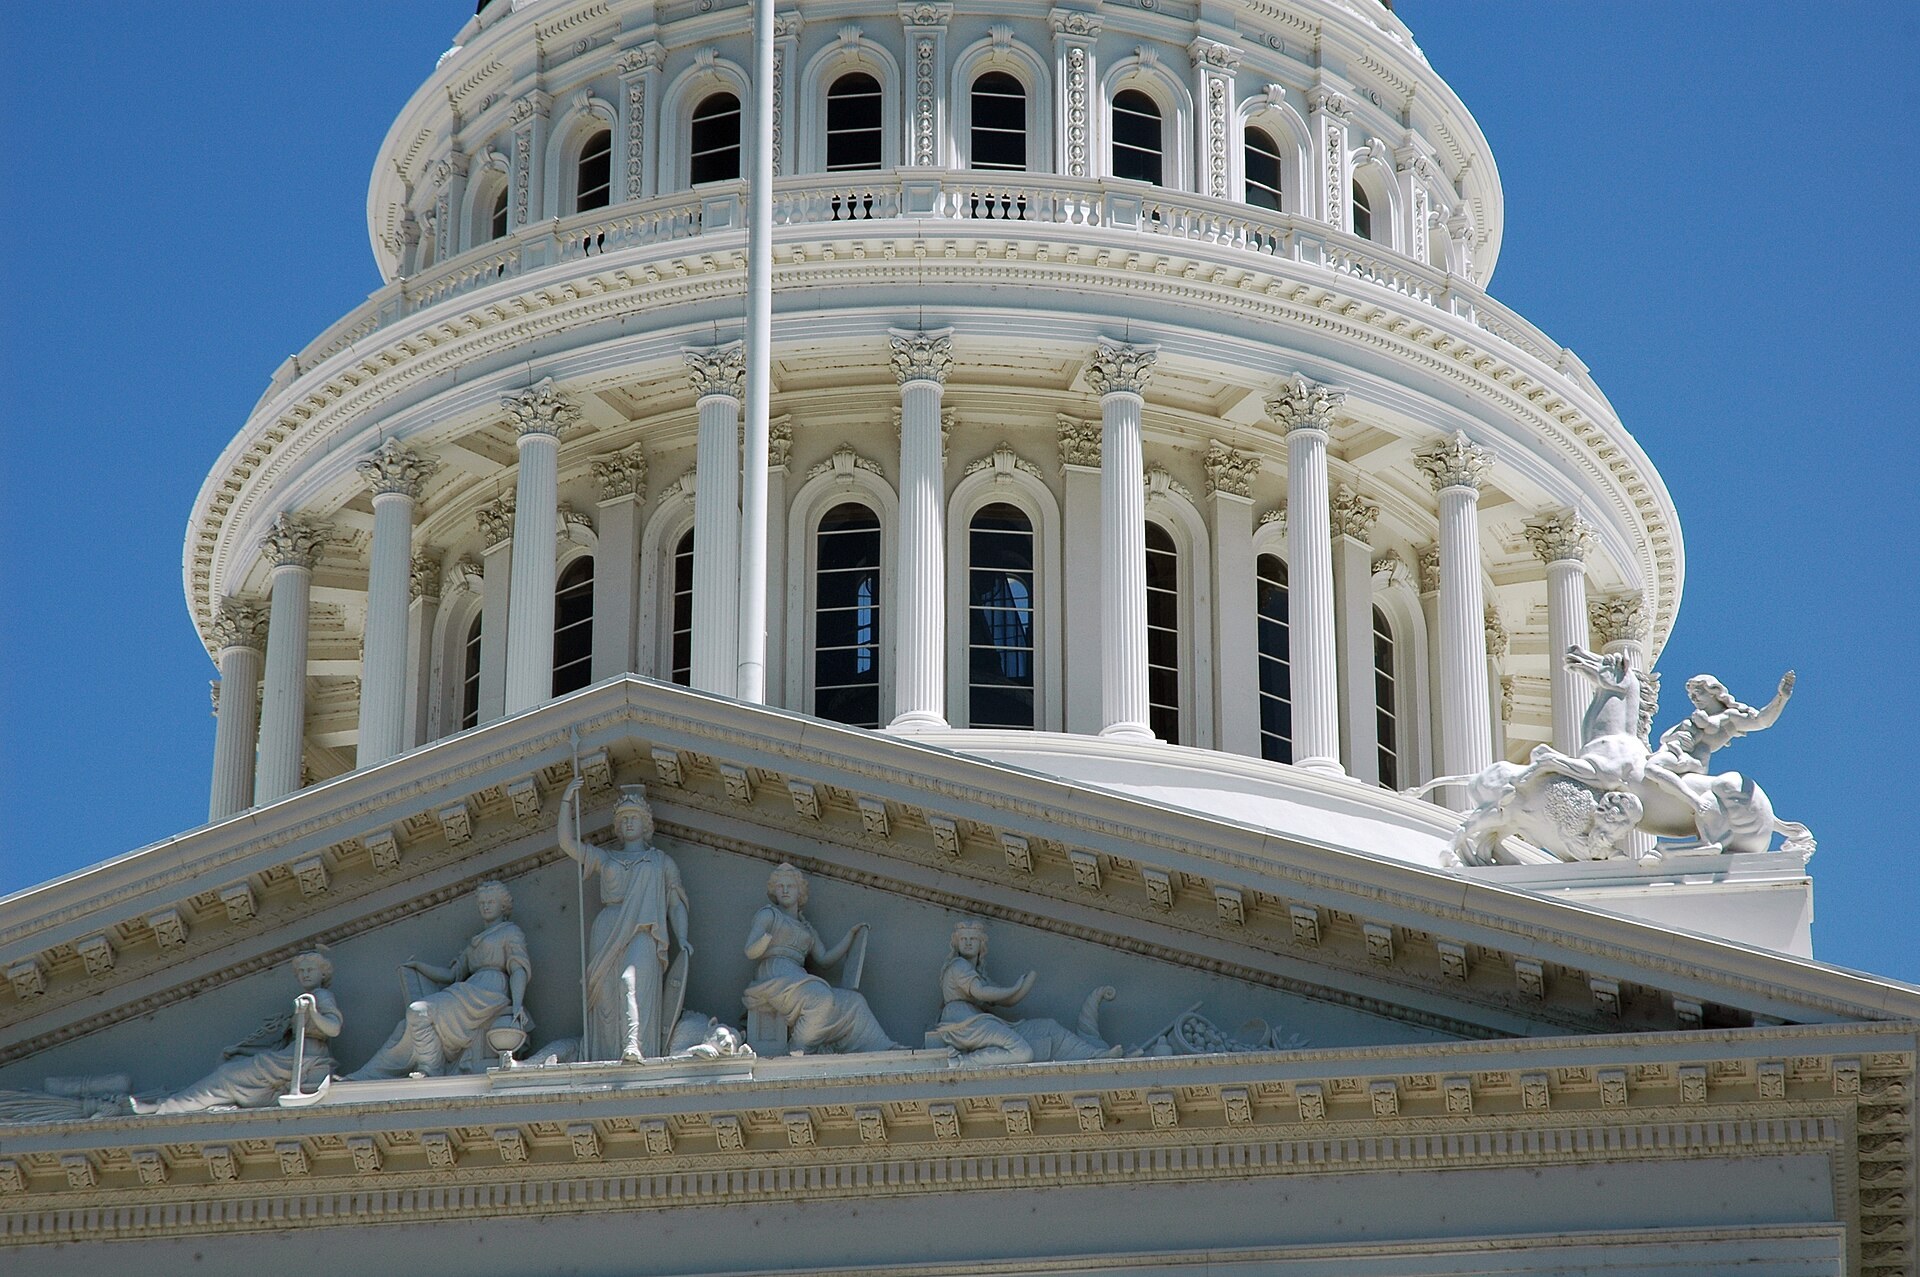
The dome and pediment of the California State Capitol in Sacramento. Photo: DimiTalen via Wikimedia Commons, CC0 public domain dedication. File photo.
Which states sit above the national rate?
The District of Columbia has the highest rate at 5.6 percent. California is next at 5.1 percent and Michigan follows at 5.0 percent, according to Table A of the release. Those are the only two states BLS flags as statistically higher than the 4.2 percent national number.
One caution on reading the table. Connecticut's rate is also 5.1 percent, up 0.9 point from a year earlier, and Oregon's is 5.0 percent, but BLS does not list either as different from the nation. Small states carry wider error bars, so a matching number does not carry the same weight.
California did improve. Its rate was 5.5 percent in September 2025 and is 5.1 percent now, per Table C. That ties it with Connecticut for the highest of any state.
Official record
U.S. Bureau of Labor Statistics, State Employment and Unemployment, September 2026, release USDL-26-1603, October 20, 2026.
"In total, 20 states had unemployment rates lower than the U.S. figure of 4.2 percent, 2 states and the District had higher rates, and 28 states had rates that were not appreciably different from that of the nation." — BLS
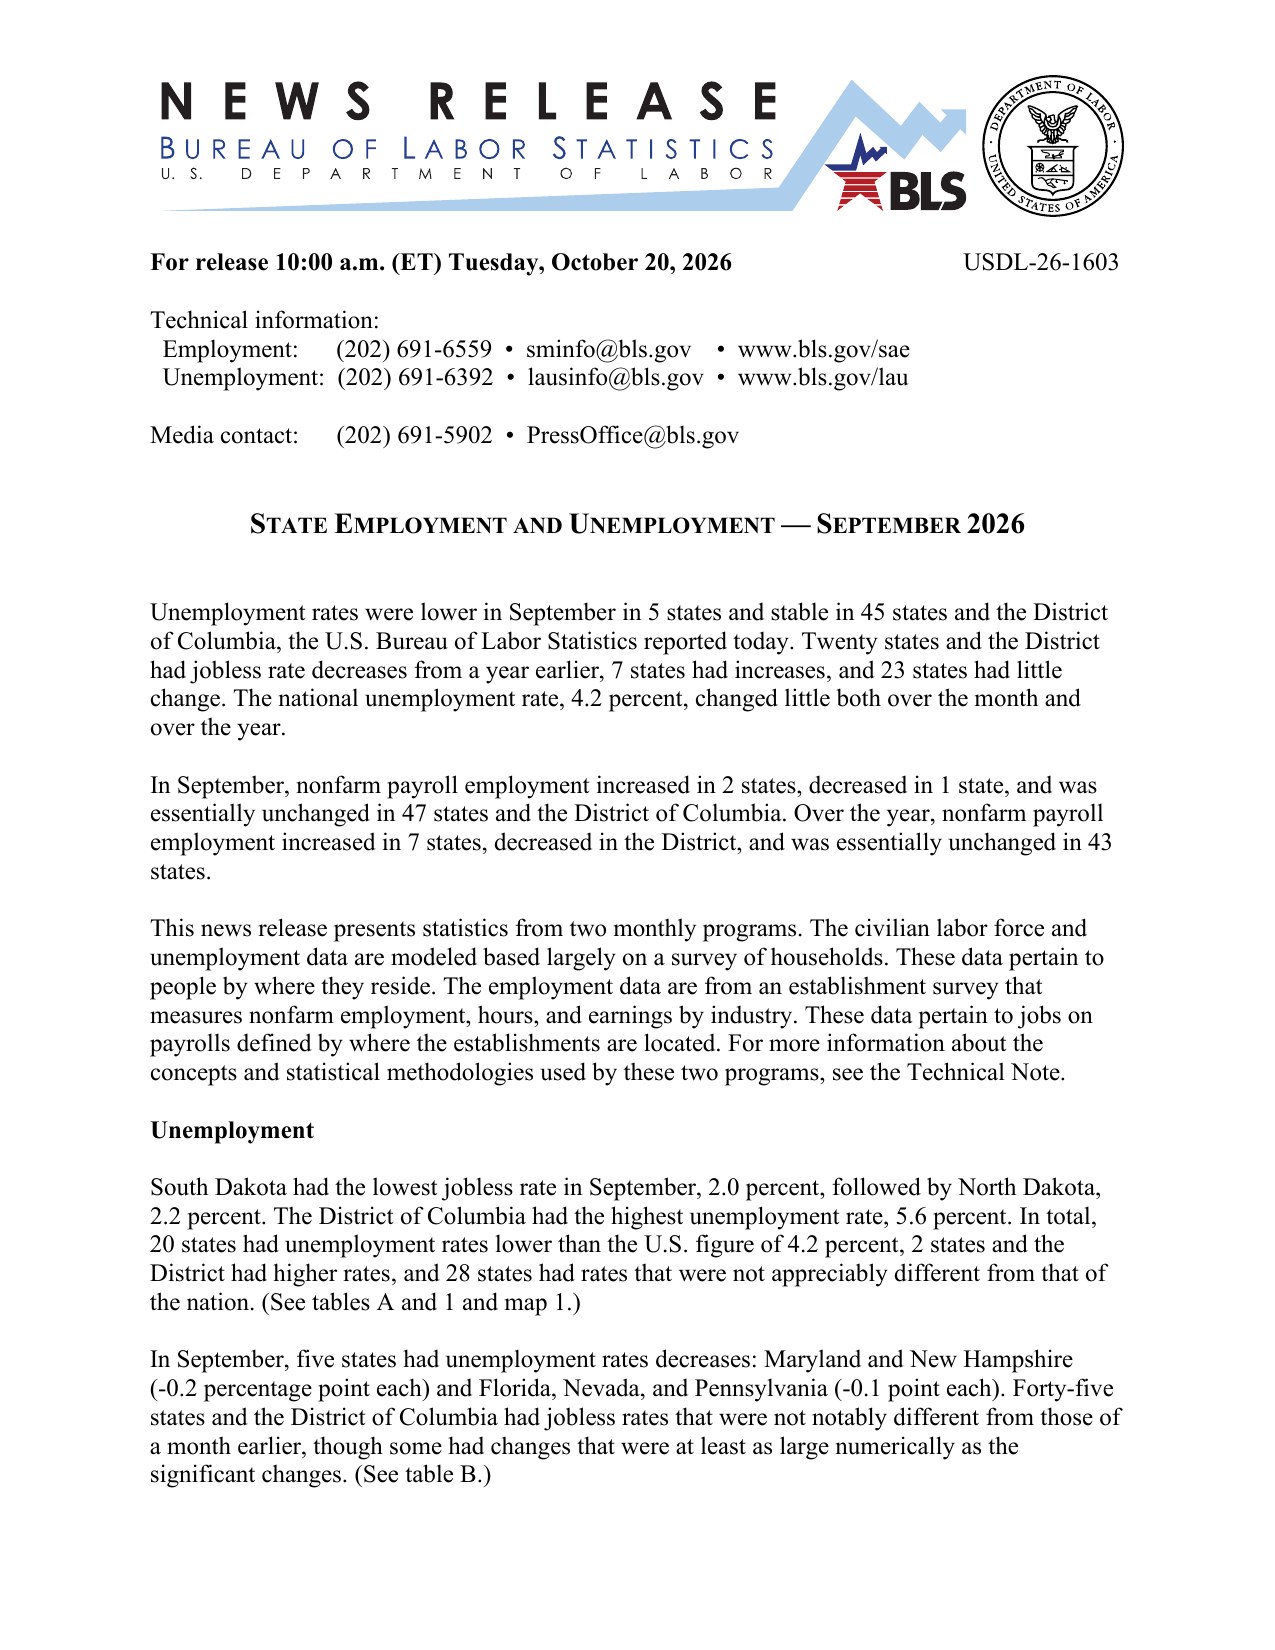
Read or download the full release (PDF) · view it on BLS.gov. BLS releases are in the public domain.
Where are the new jobs actually coming from?
Over the year, nonfarm payrolls rose by a statistically meaningful amount in only seven states, BLS reports. Texas added 154,300 jobs, California 129,300, North Carolina 67,000, South Carolina 55,200, Minnesota 36,800, Louisiana 36,000 and Utah 26,300, per Table E.
Add those up and the seven states gained about 504,900 jobs. Texas and California alone account for 283,600 of them, or roughly 56 percent. That is my arithmetic from the BLS table, not a figure BLS publishes.
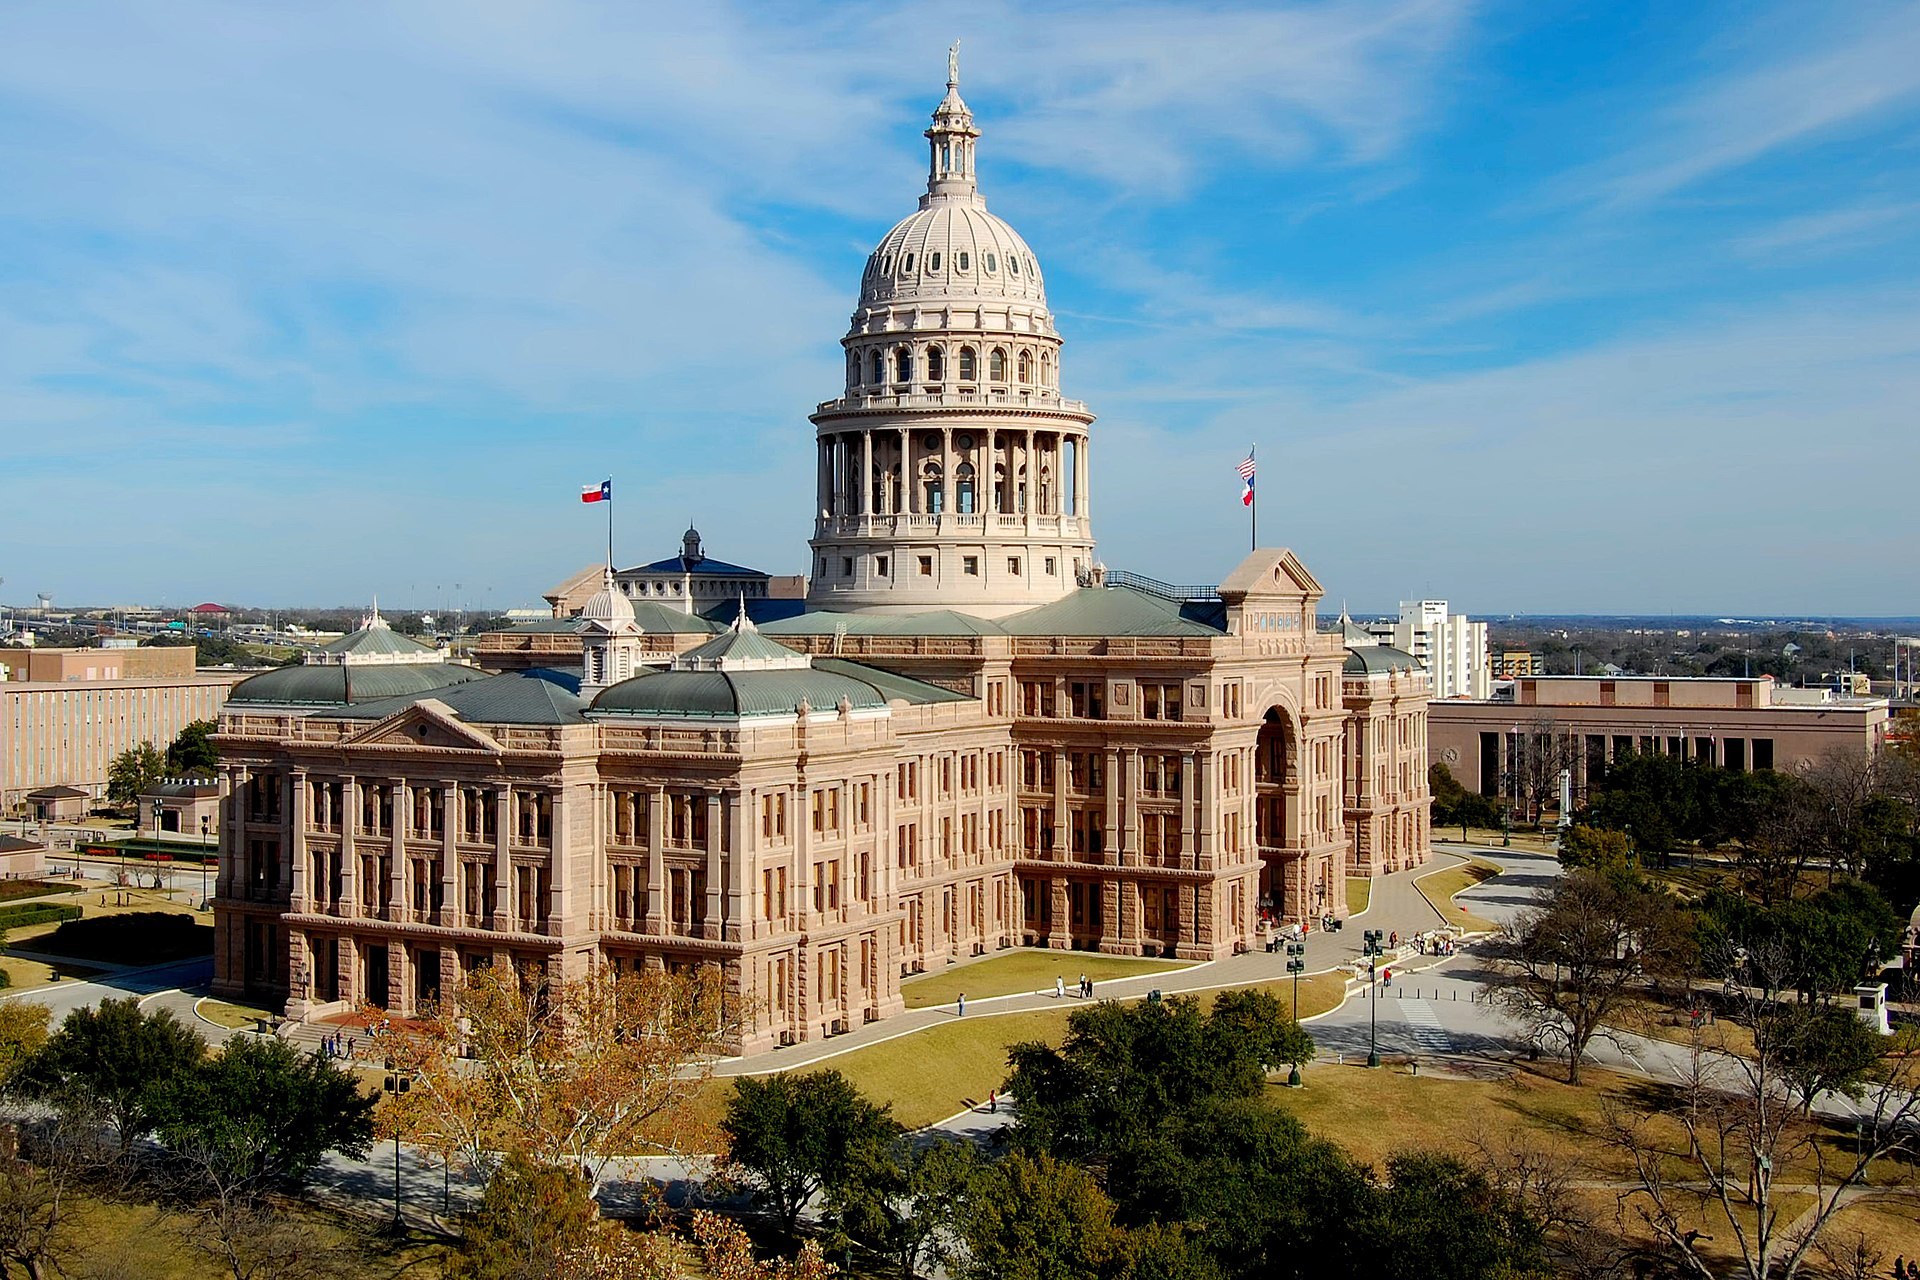
The Texas State Capitol in Austin. Photo: LoneStarMike via Wikimedia Commons, CC BY 3.0. File photo.
The release also says payroll employment was "essentially unchanged" in 43 states. That is BLS shorthand for no statistically significant change, so it does not mean zero. Wisconsin was the one state with a significant monthly loss, down 13,700 jobs in September, and DC lost 25,800 jobs over the year, a 3.5 percent drop.
Why does Michigan's number matter right now?
Michigan sits at 5.0 percent, one of only two states BLS flags as above the nation, with Election Day on November 3. The release does not say why, and the data cannot tell us. What it does show is that Michigan is not among the seven states with significant job gains this year.

The Detroit skyline seen across the river from Windsor, Ontario, August 2024. Photo: TheWxResearcher via Wikimedia Commons, CC0 public domain dedication. File photo.
Does the 4.2 percent figure tell the whole story?
It tells the national story. Wages are the other half of it. BLS's September real earnings report showed real average weekly earnings down 0.1 percent from a year earlier, with consumer prices up 3.7 percent over the same span. A steady jobless rate means people are working. It does not mean paychecks are keeping up.
For a family in Sacramento or Detroit, the state table is the better guide. The nation is not hurting for jobs, but the gains are concentrated in a few states, and two big ones are still above the national rate. Watch the October state release, due November 20, to see whether the map starts to even out.
Header photo: the Frances Perkins Building, headquarters of the U.S. Department of Labor, Washington, D.C. Photo: U.S. Department of Labor via Wikimedia Commons, CC BY 2.0.